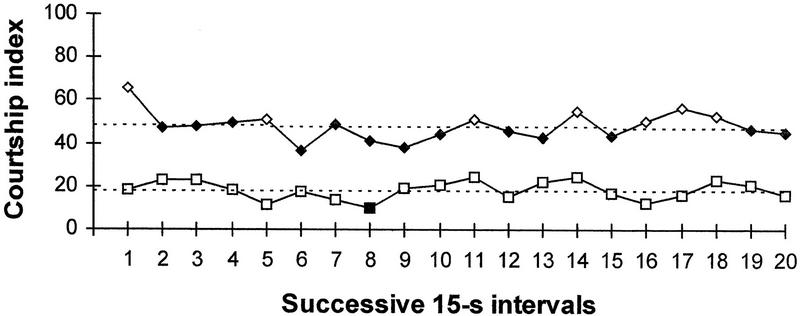
Figure 2.
Time course of the mean CI in naive (⋄, N = 22) and previously trained males (□, N = 26) in tests with mated female 8 hr after training. For each curve, the symbols are solid when the one-tailed randomization test shows a significant (P < 0.05) decrease in CI for a given period in comparison to the first 15-sec period. Linear trend lines are shown.

