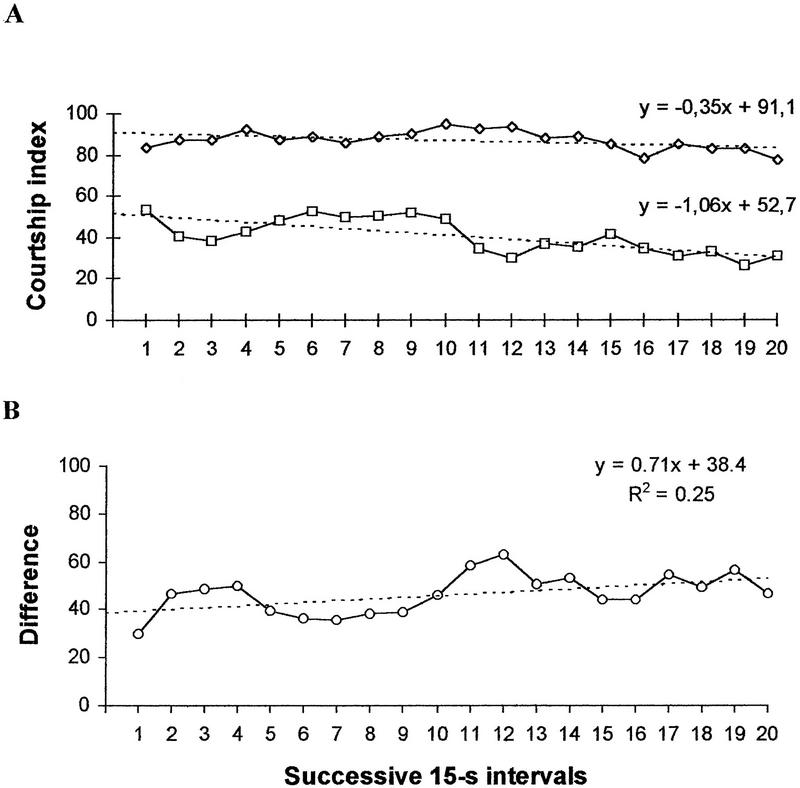
Figure 3.
(A) Time course of the mean CI in naive (⋄, N = 27) and trained males (□, N = 27) in tests with a virgin female immediately after training. (B) Time course of the difference in CI between naive and trained males. The linear trend lines and equations are shown. R2 is the determination coefficient showing what part of the total variability is explained by the linear trend.

