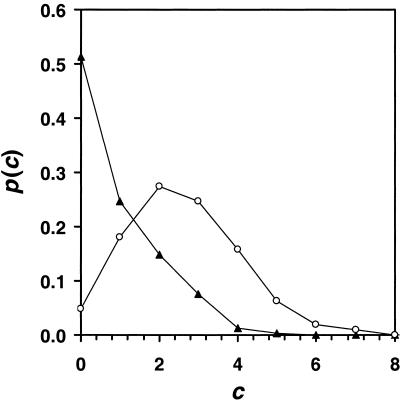
Figure 1.
The probability distribution p(c) that a positive mutation occurs at a residue with c coupled interactions. The distribution is shown at two fitness values as the sequence ascends the fitness landscape, F = 0.0 (○) and F = 17.0 (▴). Data shown are for N = 50, b = 10.0, and 50 coupling interactions. The coupling is symmetric so two residues are affected for each interaction.

