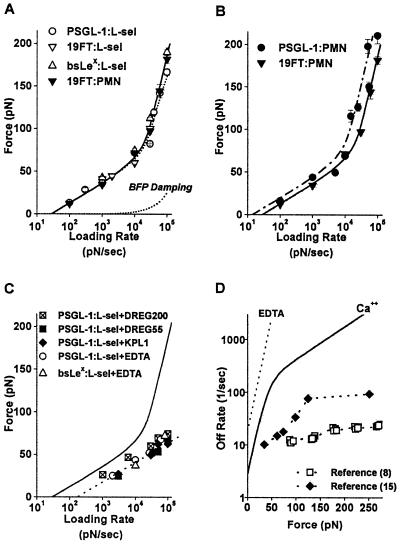
Figure 3.
(A–C) The most frequent forces observed to rupture carbohydrate bonds to L-selectin as functions of loading rate. (The values are shown ± standard error in force, which represents the uncertainty in most frequent force; standard deviations in each force histogram were always comparable to the slope of the appropriate linear-like regime, as expected for single bond kinetics.) (A) Forces in Ca2+ for 19FT attachments to L-selectin in situ on PMNs and for PSGL-1, 19FT, bsLeX attachments to L-selectin in vitro on spheres. The lower dotted curve is the correction for viscous damping added to the elastic BFP force illustrated by the upper dotted curve. The solid curve is the continuous spectrum for passage of two energy barriers: an outer barrier at a distance xβ ≈ 4Å along the direction of force with a transition rate 1/toff ≈ 3 per second and an inner barrier at a distance xβ ≈ 0.6Å with a transition rate 1/toff ≈ 100 per sec. (B) Forces in Ca2+ for PSGL-1 and 19FT attachments to L-selectin in situ on PMNs. The solid curve is the spectrum in A; the dashed-dotted curve is the spectrum predicted for a zipper of two bonds, where each bond is governed by the solid-curve spectrum. (C) Forces in 10–20 mM EDTA for PSGL-1 and bsLeX attachments to L-selectin on spheres and for PSGL-1 attachments to L-selectin on spheres in Ca2+ blocked by mAbs KPL1, DREG55, and DREG200. The solid curve is the spectrum in A. (D) Kinetic profiles for rate of PSGL-1 dissociation from L-selectin under force in Ca2+ (solid curve) and in EDTA or blocked by KPL1 and DREG 55 (dotted curve). Also shown are rates of transient cell detachment observed at different video framing speeds, 30 per sec (9) and 240 per sec (16), in flow chamber studies.

