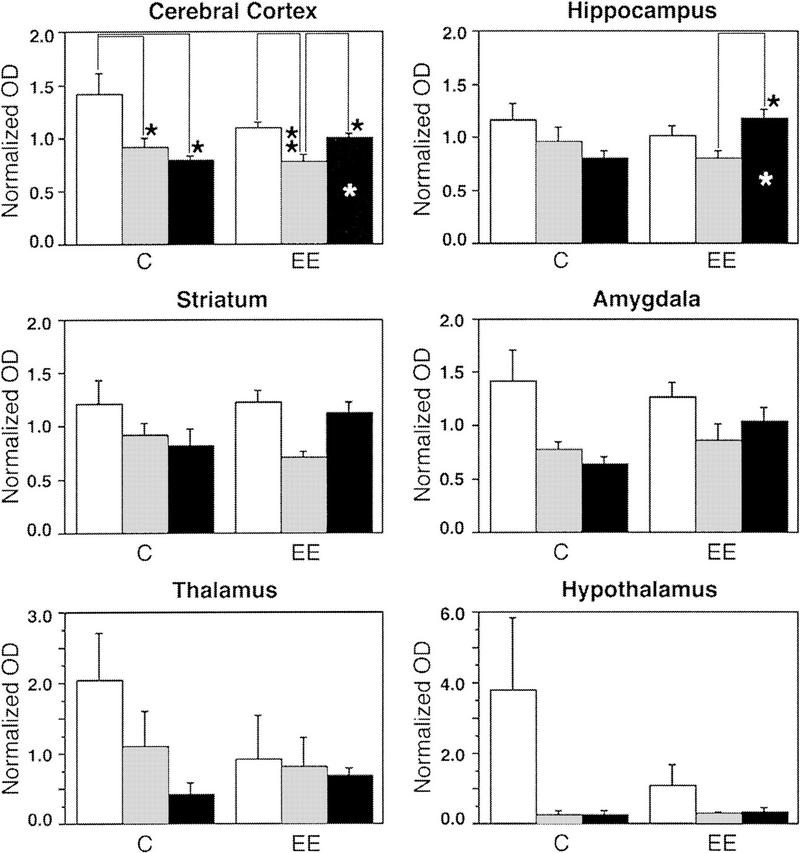
Figure 3.
Analysis of zif-268 expression during waking and sleep states in six major brain regions; cerebral cortex, hippocampus, striatum, amygdala, thalamus, and hypothalamus. Statistically significant interactions (MANOVA) between expression profiles occurred for the cerebral cortex (P = 0.04) and the hippocampus (P = 0.03). Whereas zif-268 expression in controls decreased from WK to SW and to REM, in animals exposed to the enriched environment, zif-268 levels decreased from WK to SW but increased from SW to REM. Values on the y-axis represent normalized optical density (OD) measurements (means ± s.e.m.) of X-ray film autoradiograms; statistically significant differences (Bonferroni-Dunn) are indicated by one (P<0.05) or two (P<0.01) asterisks. White, gray, and black columns represent, respectively, WK, SW, and REM. Asterisks inside columns indicate state differences between C and EE groups.

