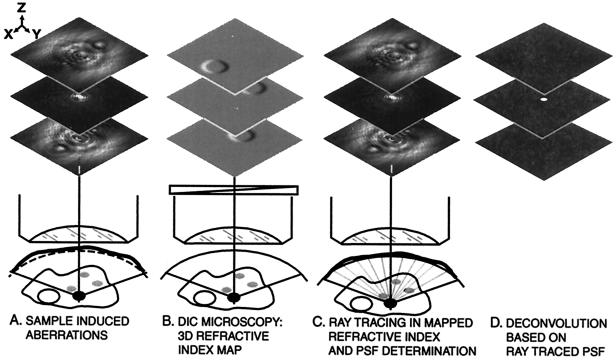
Figure 2.
The solution: A schematic outline. (A) Sample-induced aberration: The imaging situation is modified by variations in refractive index within the sample volume, resulting in highly distorted wavefront originating from the point source. For the presentation, three spheres with refractive index higher by 0.15 units above the medium were simulated in the sample volume. For viewing purposes, the in-focus image is 30 times attenuated with respect to the out-of-focus images shown (unaberrated cases would have 300 times the corresponding attenuation). (B) Evaluating the refractive index variations within the sample: The imaging conditions in A are observed with DIC optics (symbolically shown by the Wollaston prism), resulting in the 3D image consisting of a series of two dimensional gradient images of the refractive index of the sample. The three DIC images shown are at focal planes centered about the three spherical objects. They are processed by line integration (29) to yield a 3D map of the refractive index of the sampled volume. (C) Ray tracing through the sample: Light rays emerge isotropically from a point within the sample volume. Computerized ray tracing for the shown three spheres in the sample volume gives the distorted diverging wavefront at the entrance pupil of the microscope due to refraction of the ray directions and deviation of their optical paths from the ideal spherical wavefront (illustrated by extended ray ends). The Kirchhoff interference integral is applied to this wavefront to calculate the corresponding distorted point diffraction 3D image. (D) Deconvolution by using the distorted image reconstructs a point source.

