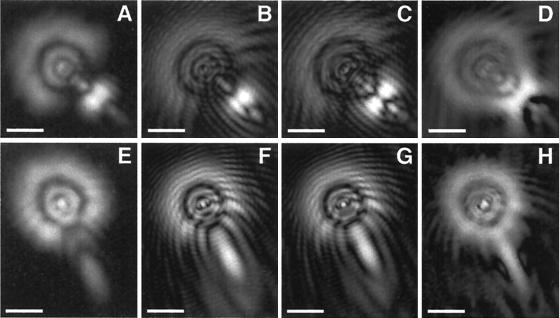
Figure 4.
Comparison of measured and calculated PSFs: A–D are defocused optical sections of bead 1 (as labeled in Fig. 3A) at 3.0 μm below focus and E–H are optical sections of bead 2 at 2.75 μm below focus. (A and E) A measured image of the 0.1 μm bead. (B and F) A computed 3D ray-traced PSF using a refractive index map from the line integrated oil drop DIC data. (C and G) A ray-traced PSF using simulation of an oil drop with uniform known refractive index. (D and H) A computed PSF in which the aberrated wavefront calculated by ray tracing through a simulated oil drop of uniform refractive index was applied to a measured, unaberrated PSF by using Eqs. 2a–2e. (Scale bars, 2 μm.)

