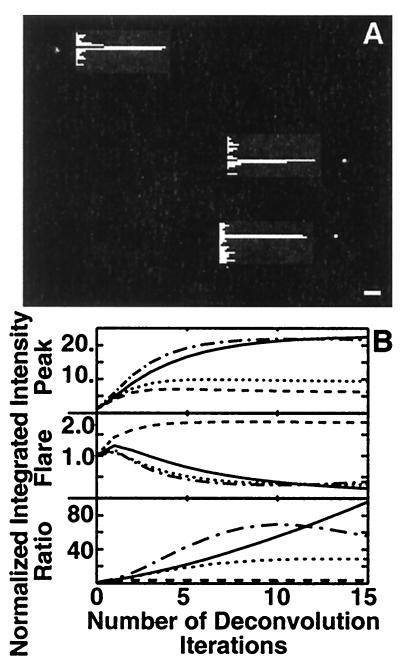
Figure 5.
Deconvolution results: (A) The beads shown in Fig. 3A were deconvolved with the ray-traced PSFs based on the refractive index map computed from Fig. 3B. The line profiles through the bead centers plot the logarithmic intensities down to the 10−4 noise level. (Scale bar, 2 μm.) (B) A quantitative comparison of the effect of various PSFs on the deconvolution process for bead 1 of Fig. 3A is shown as a function of the number of iterations. (Top) The peak integrated intensity. (Middle) The integrated intensity of the flare. (Bottom) The ratio of peak to flare intensity, a figure of merit for deconvolution effectiveness. Each plot has been normalized to the predeconvolution integrated intensity. The PSFs used to deconvolve bead 1 are: the image itself (Fig. 4A, solid line), a bead image taken under conditions of minimal distortions (Fig. 1A, dashed line), a ray-traced computed PSF based on the simulated refractive index map (Fig. 4C, dotted line), and a PSF calculated by applying the ray-traced wavefront distortions to a measured, unaberrated PSF using Eqs. 2a–2e (Fig. 4D, dash–dot line). After 15 deconvolution iterations, the signal (peak) intensity to nonsignal (flare) intensity ratio is improved 8-fold by using the ray-traced PSF and 15-fold by using the PSF modified by Eqs. 2a–2e, when compared with those using an unaberrated PSF.

