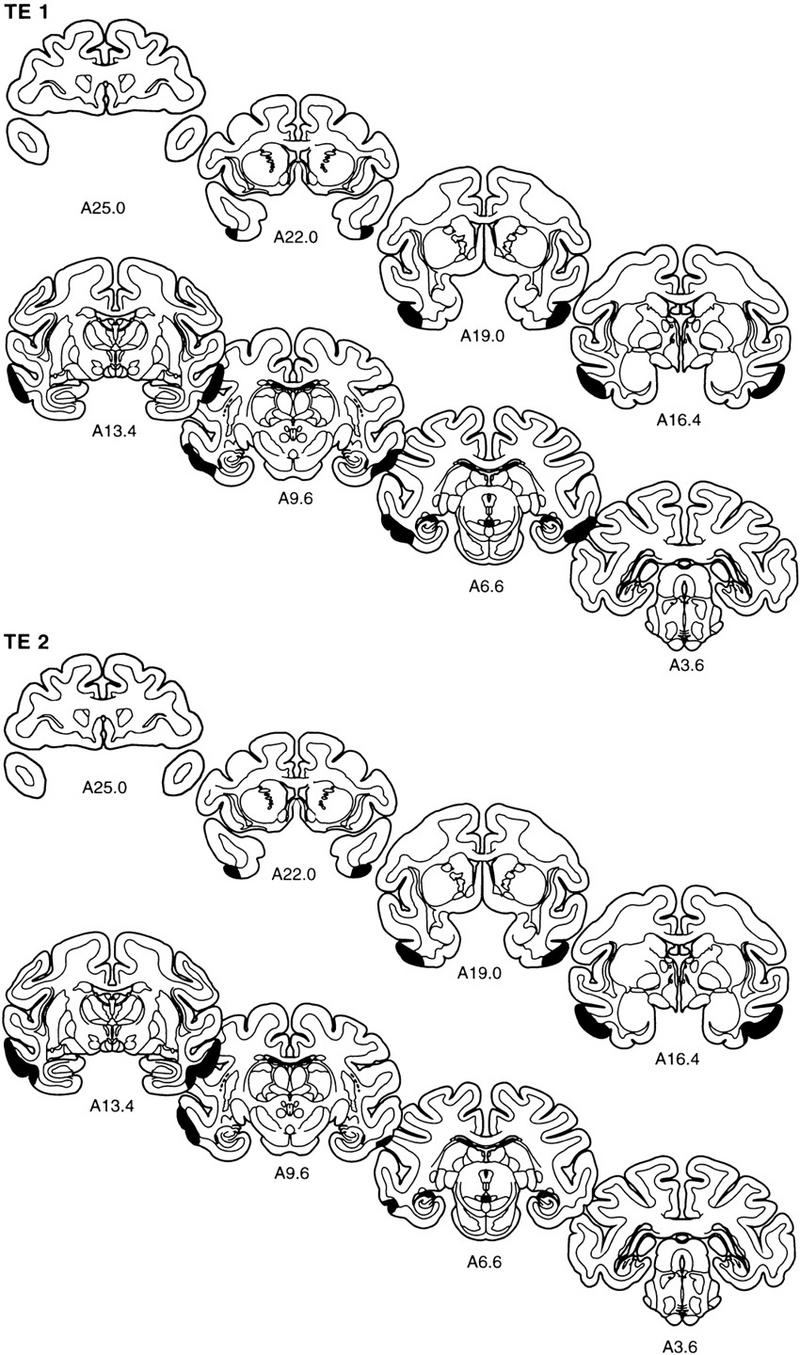
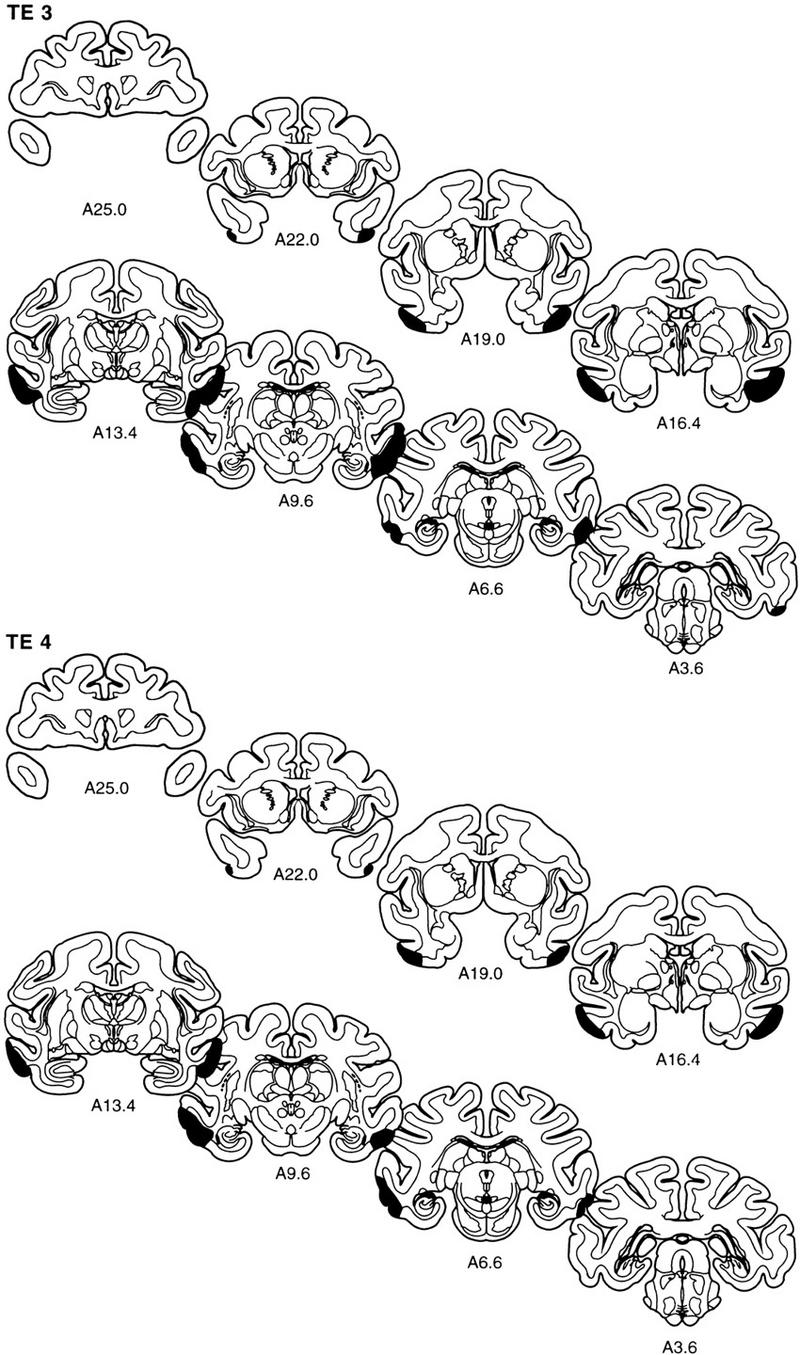
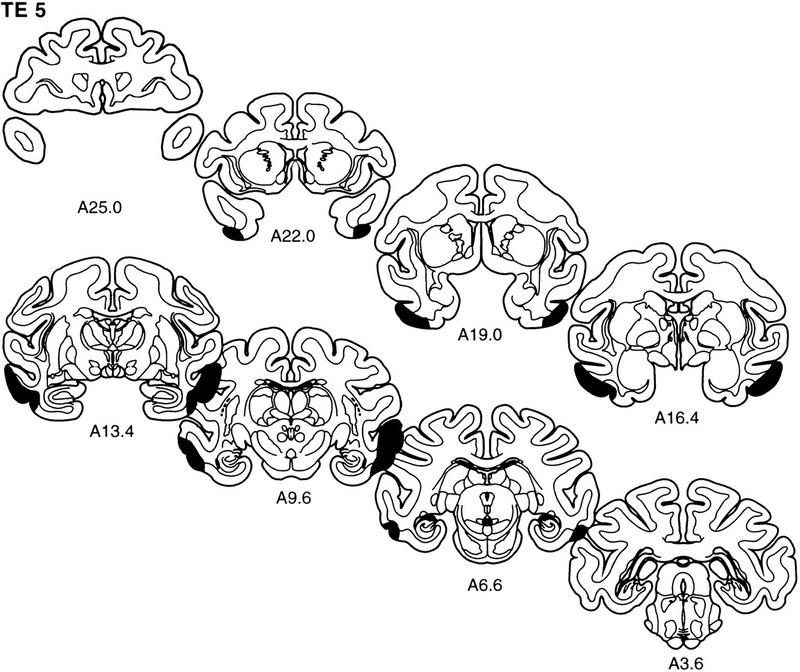
Figure 5.


The extent of the lesions of area TE in each of the five monkeys in the TE group (TE 1–TE 5) is plotted on representative coronal sections redrawn from the atlas of Szabo and Cowan (1984). In each case, the area of the lesion is indicated in black. The rostrocaudal level is indicated below each section (see Figs. 1 and 2 for borders of area TE).
