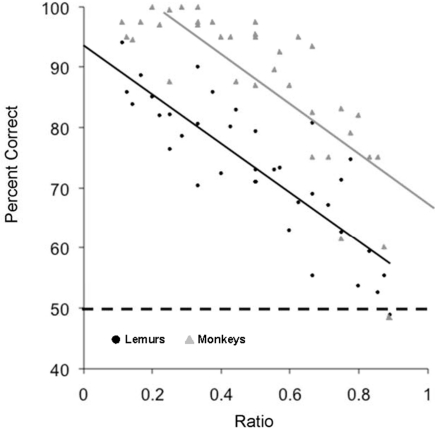
Figure 7.
Lemur accuracy (black circles) for Experiment 2B as a function of the numerical ratio between the values being compared. Monkey data (gray triangles) from Brannon and Terrace (2000) is plotted for comparison. The regression slopes for the two species are highly similar (lemurs: y = −40.57x + 93.69; monkeys: y = −41.31x + 108.6). The dotted line indicates chance for the task.

