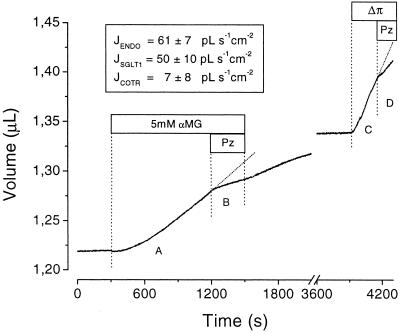
Figure 2.
Analysis of water transport during prolonged exposure to 5 mM αMG. Oocyte volume is displayed as a function of time. αMG was present between t = 300 s and 1,500 s, and Pz was added as indicated. After a recovery period in the absence of αMG, an osmotic shock was imposed to enable water permeability measurement. (Inset) Calculated fluxes passing through the three presumed water pathways: endogenous water permeability (JENDO), SGLT1 passive permeability (JSGLT1), and cotransported with Na+ and αMG (JCOTR).

