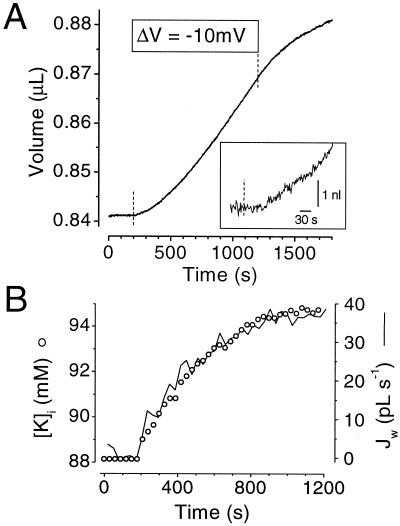
Figure 4.
Effect of a K+ inward current on oocyte volume and intracellular K+ concentration. (A) Average volume measurements in ROMK2-injected oocytes (n = 3). At t = 180 s, the oocyte membrane was hyperpolarized by 10 mV to stimulate an inward K current averaging 1.8 μA. (Inset) Enlargement of the initial portion of the curve shown in A. The dotted line represents the time at which the inward current was stimulated. (B) Parallel increases in intracellular K+ concentration ([K]i, ○) and in the instantaneous water flux (Jw, full line). [K]i was obtained from the K+ reversal potential and Jw was obtained from the slope of the curve shown in A, which was measured every 30 s using a time window of ± 25 s.

