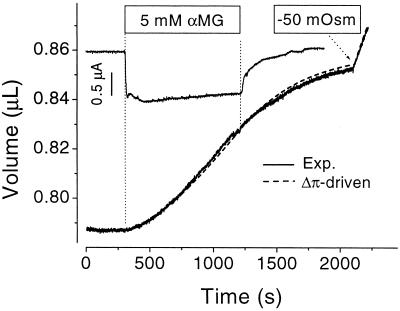
Figure 5.
Theoretical fit using the osmolyte accumulation model. Oocyte current and volume are shown as a function of time. From t = 300–1,200 s, 5 mM αMG was added to the bathing solution and at t = 2,100 s, 50 mM mannitol was removed from the external solution. Superposition of the experimental data (full line) to the theoretical prediction (dashed line) from the accumulation model are presented.

