
Figure 1.
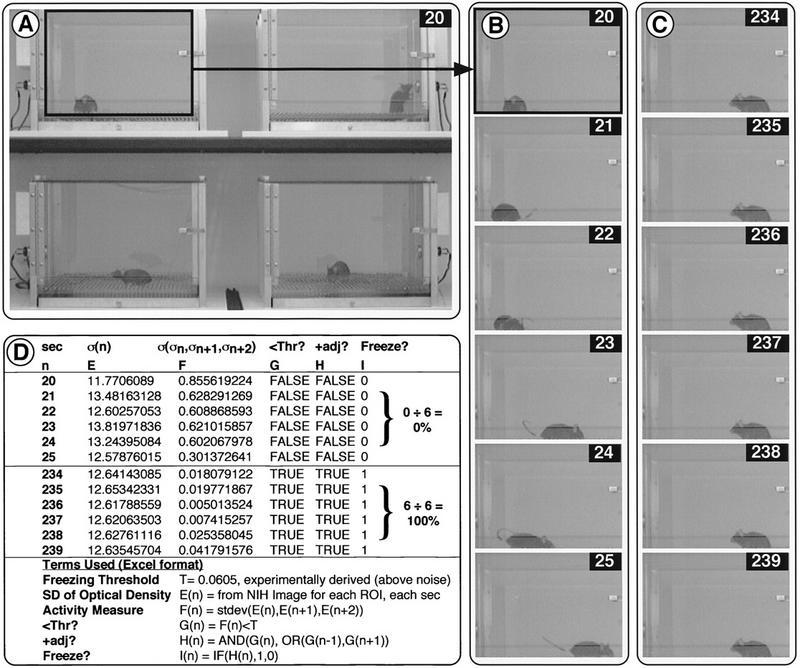
Visual depiction of the technique. (A) Full-screen video of all four chambers was captured at 1 Hz by NIH Image. The mice shown here were recorded for 302 sec and given a shock at 150 sec. The full-screen frame shown is from 20 sec (black numbers indicate time). (B) Video was analyzed by separating the video in four ROIs corresponding to the inside of the chambers. Shown here is an example of a naive mouse, 20–25 sec after being placed in the chamber. (C) Shown here is the same mouse exhibiting post-shock freezing during seconds 234–239. (D) Values and processing required to compute freezing from the video frames shown in B and C. The standard deviation of the optical density from the region of interest (chamber) for each frame (second) was obtained from NIH Image (shown in column E). The standard deviation of this value from three adjacent seconds was then computed as a movement score (F). This value (F) was used as the activity measure itself. It was determined if this was below the threshold for freezing (G), set just above the noise video signal (T). Then a freezing observation was only made if there was also an adjacent observation (i.e., the next or previous observation was also freezing; H). Finally, this was converted to a 1 for freezing and 0 for nonfreezing so these could be counted (I).