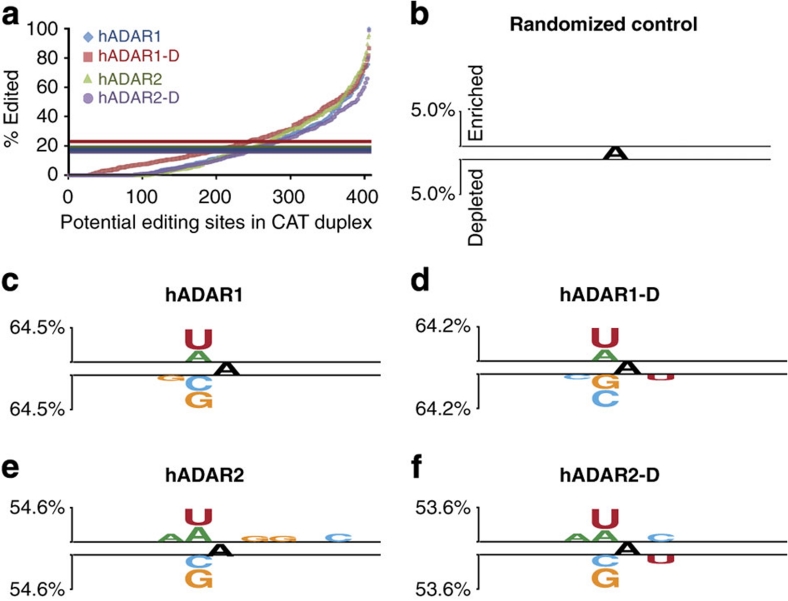
Figure 1. Binary analysis using Two Sample Logo software.
(a) Bulk sequencing of the 795-bp dsRNA RT–PCR product allowed measurement of 406 adenosines on the sense and antisense strands combined. The plot arranges each site in order of increasing percentage of editing measured within the population of RT–PCR products. Coloured horizontal lines show mean overall A-to-I conversion of the 795-bp dsRNA incubated with each ADAR: hADAR1 (blue)=17.8%, hADAR1-D (red)=22.7%, hADAR2 (green)=19.1% and hADAR2-D (purple)=16.4%. For Two Sample Logo analyses (b–f), sequence contexts edited to a greater extent than the mean were scored as enriched, and those edited less than the mean as depleted. Neighbour preferences of the different ADARs were determined from a single incubation, but repeated experiments showed the same relative pattern of editing among the 406 adenosines, even when protein concentrations differed between experiments. (b–f) Logo displays enriched bases above top line and depleted bases below bottom line for neighbouring five bases on both sides of the central edited adenosine. Level of enrichment/depletion is shown by letter heights with reference to scale on the left; y-axes as in (b). Two Sample Logo settings: t-test, show base if P value <0.005 and no Bonferroni correction25. Panels show: (b) Two Sample Logo of Randomized Control; (c) hADAR1; (d) hADAR1-D; (e) hADAR2; and (f) hADAR2-D.

