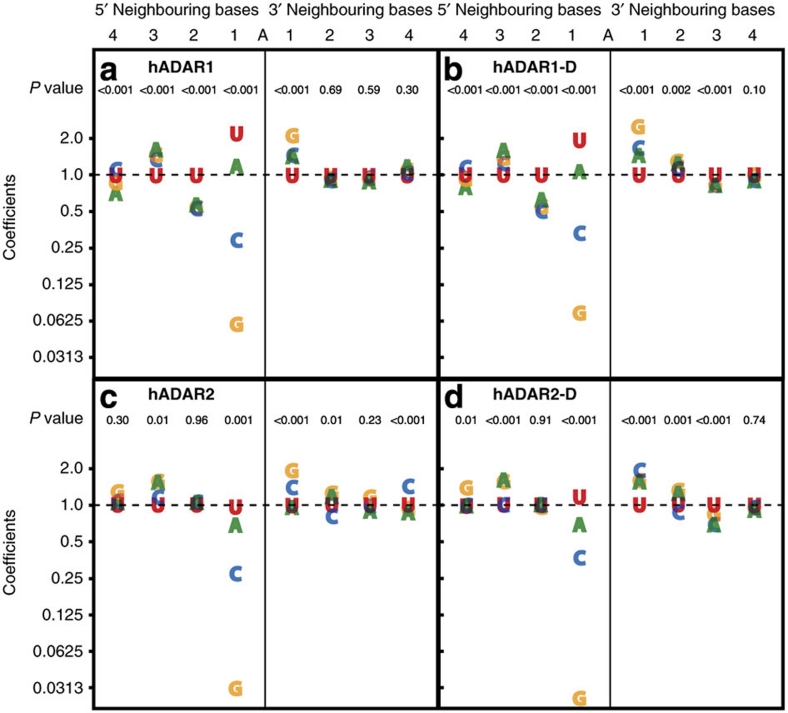
Figure 3. Analysis of the coefficients for the eight-term model.
The vertical axis of each panel (a–d for the different ADARs) plots the coefficients used in the eight-term multiplicative regression model (numerical values in Supplementary Data 1). To obtain an estimate of the % editing of a target adenosine, coefficients for each of the eight-base positions are multiplied together, and this value is multiplied by 20 to account for the normalization of the mean % editing to 20% (see Methods). The P values given for 5′ and 3′ positions (top of each panel) evaluate the null hypothesis that the % editing of the target adenosine is unrelated to the identity of the base at that position; a small P value indicates that at least two of the four possible bases at the indicated position lead to different amounts of editing of the target adenosine. Widely dispersed plot symbols (and low P values) at a particular position indicate a large effect of the identity of the base at that position on the % editing of the target adenosine, whereas overlapping plot symbols (and high P values) indicate little or no effect of the identity of the base at that position.

