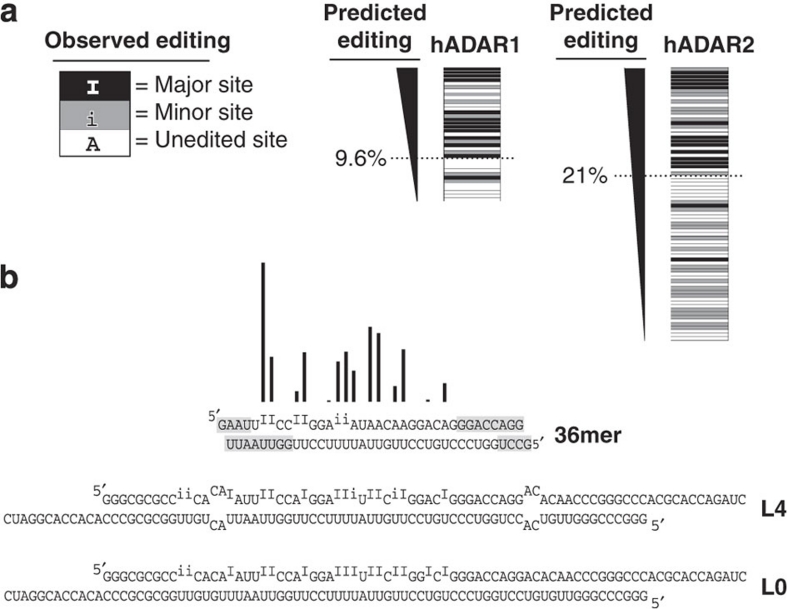
Figure 4. The hADAR1 and hADAR2 eight-term nearest neighbour regression models as predictive tools.
(a) The major (black), minor (grey) and below-detection/no editing (white) sites of dsRNAs previously reported18 are ranked according to percentage of editing predicted by the eight-term best-fit model. In the previously published analysis, the boundary for scoring a site as edited/unedited was dictated by the sensitivity of methods available at the time. We used a best-fit analysis to define this cutoff as 9.6% for hADAR1, and 21% for hADAR2. Locations of editing sites within these dsRNAs are shown in Supplementary Figure S1. (b) Bar height shows relative levels of editing in the 36-bp sequence, as predicted by the eight-term model for hADAR1. The 36-bp dsRNA is shown below as a free molecule, or bounded by internal loops (L4) or additional contiguous base pairs (L0). Published patterns of editing in the three dsRNAs were determined with Xenopus laevis ADAR1, whose neighbour preferences are identical to those of hADAR1 (ref. 18). Editing in the three dsRNAs was determined by primer extension20, with sites qualitatively categorized as major (I) or minor (i). Grey highlighted ends of duplexes represent regions where ADARs are unable to edit due to proximity to termini18.

