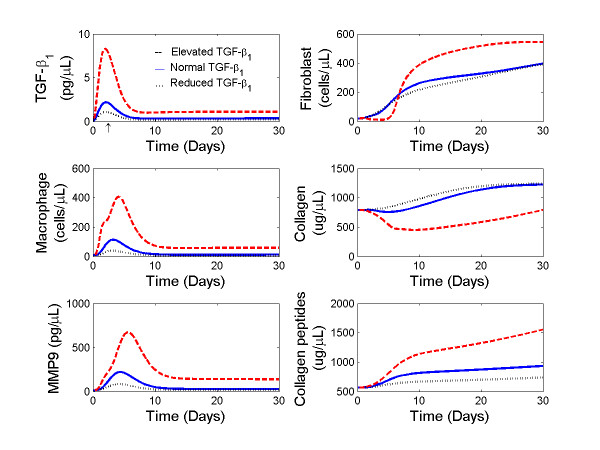
Figure 5.
Temporal profiles of TGF-β1, macrophages, MMP-9, fibroblasts, collagen, and collagen peptides from days 0 to 30 post-MI in response to low (····), median (blue line), and elevated (red dash) TGF-β1 stimuli. The initial conditions were set to F(0) = 20 cells/mm3 and MΦ(0) = 5 cells/mm3, Tβ(0) = 0.21 pg/μL, M9A(0) = 7.1 pg/μL, C(0) = 839.5 μg/μL, CM9(0) = 447.6 μg/μL, according to measurements in normal myocardium. The symbol ↑ indicates the peak time of TGF-β1 stimulus.

