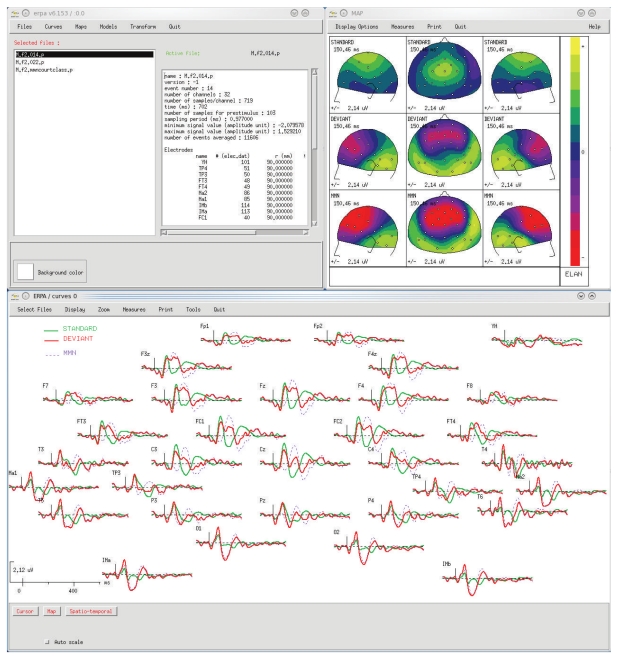
Figure 2.
ERPA visualization tool for averaged signals (.p file), with an example of scalp auditory ERPs (MMN protocol). Top left window: main ERPA window to select files and launch visualization tools. Bottom: time courses of event-related responses (positivity is up). Top right: mapping of event-related responses, here with several views of three different ERPs at the same latency. In the windows where data are visualized, plotting functions and tools for on-the-fly signal processing or measurements are available through the menus at the top.

