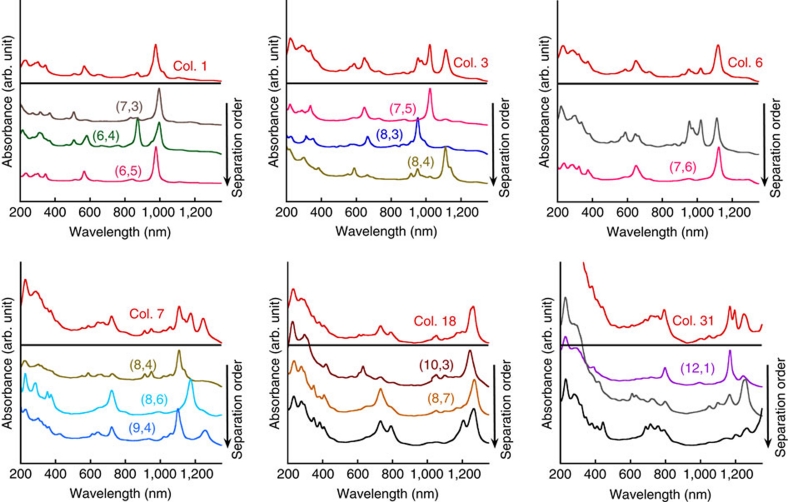
Figure 3. Optical absorption spectra of nanotube fractions sorted in the second separation.
In each spectral pattern, the top spectrum corresponds to one of the first separated S-SWCNT fractions, and the lower spectra are the optical absorbances of the corresponding second separated S-SWCNT fractions. The arrows indicate the separation order of the S-SWCNT fractions in the second separation (Col., column; S, semiconducting).

