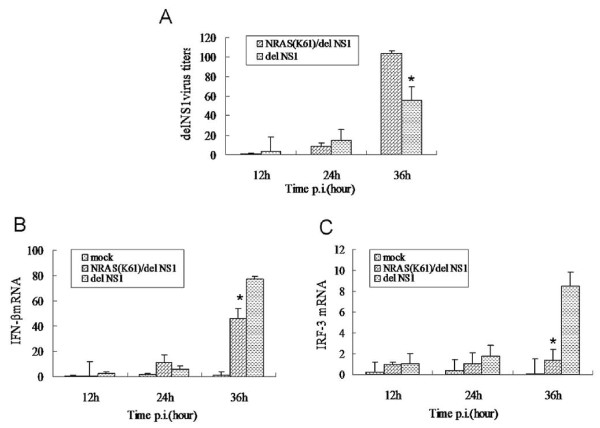
Figure 3.
NRAS (K61) transfected cells showed increases of delNS1 virus (A) and lower activation of IFN-beta(B) and IRF-3 (C). (A, B and C) At the times after infection indicated, cells were collected, and the total RNA was extracted. The amount of NP, IFN-beta and IRF-3 mRNA was determined by using quantitative RT-PCR. *Significant differences (p < 0:05, Manne Whitney test).

