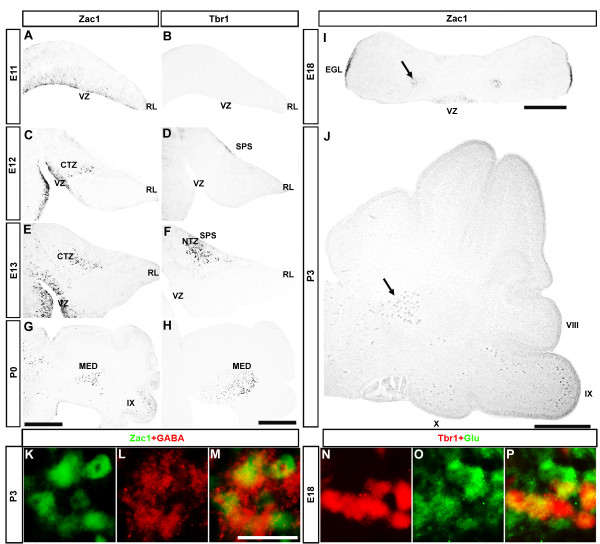
Figure 1.
Zac1 and Tbr1 mark distinct cell populations in the developing cerebellum. (A-H) Expression of Zac1 (A,C,E,G) and Tbr1 (B,D,F,H) in E11 (A,B), E12 (C,D), E13 (E,F) and P0 (G,H) neighboring sagittal sections of the cerebellum. (I,J) Expression of Zac1 in E18 transverse sections (I) and P3 sagittal sections (J) of the cerebellum. Arrows in (I,J) mark the medial nucleus. (K-M) Transverse section of P3 cerebellum labeled with anti-Zac1 (green) and anti-GABA (red). (N-P) Transverse section of E18 cerebellum labeled with anti-Tbr1 (red) and anti-glutamate (green). Scale bars: 500 μm (H,I); 250 μm (J); 25 μm (M). CTZ, cortical transitory zone; MED, medial nucleus; NTZ, nuclear transitory zone; RL, rhombic lip; SPS, subpial stream; VZ, ventricular zone.

