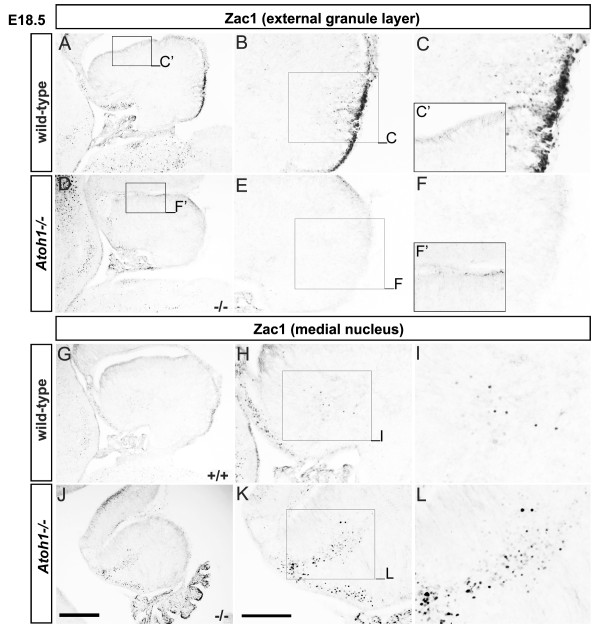
Figure 4.
Zac1+ Golgi cells are derived from the Atoh1/Math1-dependent EGL. (A-L) Zac1 expression in E18 wild-type (A-C,G-I) and Atoh1 null (D-F,J-L) cerebellum. The rectangles in (A,B,D,E,H,K) indicate the locations of the higher magnification images in the adjacent panels. Scale bars: J = 250 μm (A,D,G,J); K = 125 μm (B,E,H,K).

