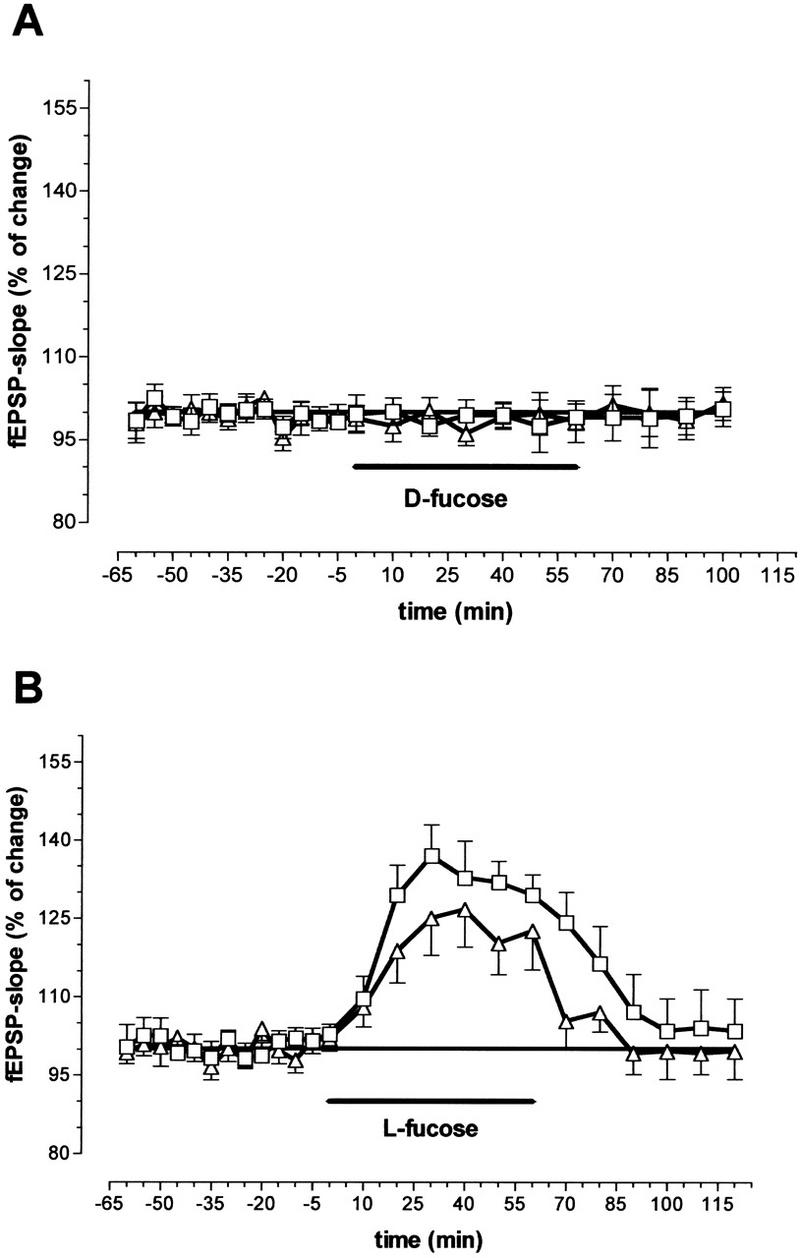
Figure 5.

Influence of 0.2 mm d-fucose (A) and 0.2 mm l-fucose (B) on the slope function of the fEPSPs recorded in the CA1 region after paired-pulse stimulation with a fixed interstimulus interval of 50 msec and near-threshold intensity. (□) First EPSP; (▵) second EPSP (N = 8 animals). Ordinates indicate percent deviation from predug values. (Horizontal bars) Substance application; (vertical bars) s.e.m.
