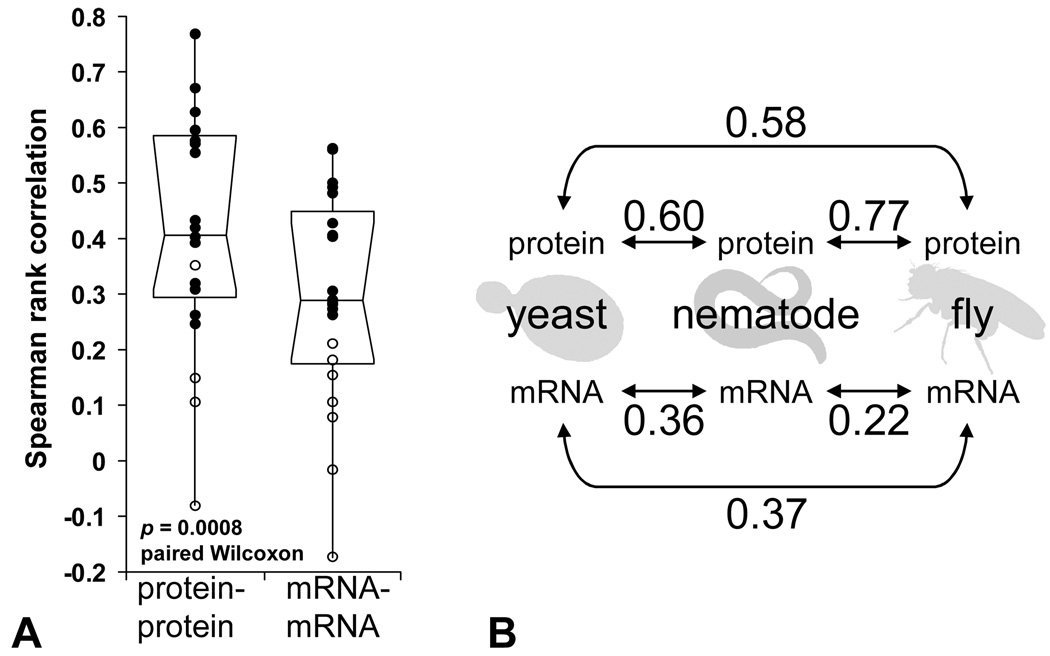
Figure 2.
Protein abundances are better conserved across seven taxa than mRNA abundances. (A) Summary of the measured distributions of protein-protein correlations and mRNA-mRNA correlations as outlier box-plots indicating the median +/− 1 quartile, with whiskers indicating ±1.5 interquartile ranges. Individual observations with p-value < 0.01 are plotted as filled circles, and observations with p-value ≥ 0.01 as open circles. Additional statistical tests are in the online Supplement. (B) Correlations using only SAGE or RNAseq transcript abundance measurements for organisms for which those data were available. Protein abundance correlations are substantially larger than mRNA abundance correlations in all three available cases (n = 700, 774, and 2680 for yeast-nematode, yeast-fly, and fly-nematode comparisons, respectively).

