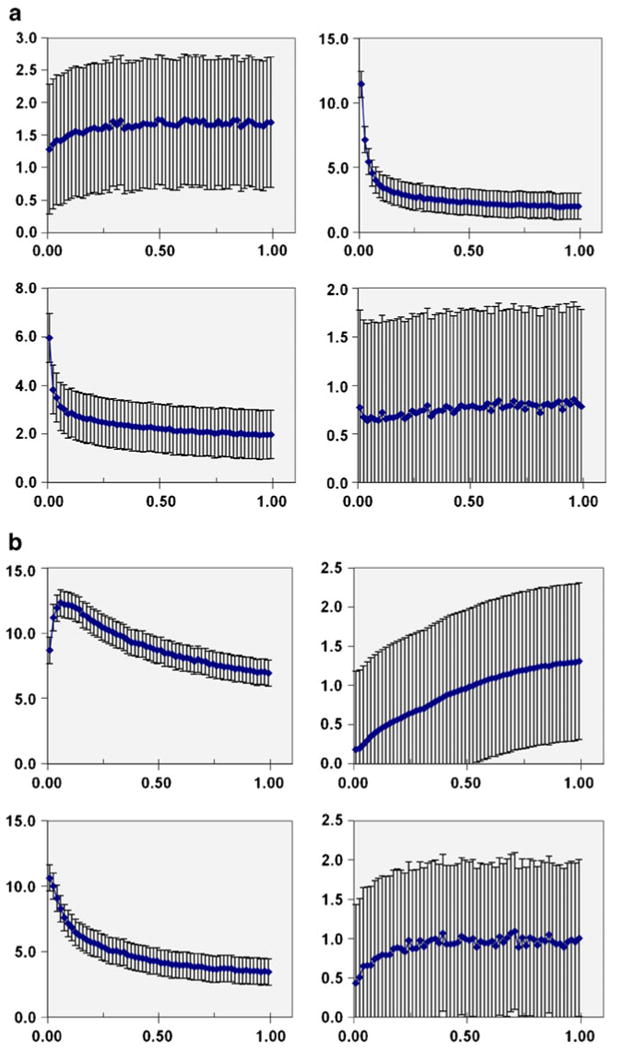
Fig. 3.

Organ activity time data from animal PET imaging. Each datum shown represents the average value from ten mice studied; with error bars indicating the standard deviation. Abscissa in units of hours after tracer injection. Ordinate axis in units of % IA/mL; except for urinary bladder data plotted in units of % IA. Top left: bone; top right: cardiac blood pool; bottom left: lungs; bottom right: brain. Organ activity time data from animal PET imaging. Each datum shown represents the average value from ten mice studied; with error bars indicating the standard deviation. Abscissa in units of hours after tracer injection. Ordinate axis in units of % IA/mL; except for urinary bladder data plotted in units of % IA. Top left: liver; top right: urinary bladder (excreta); bottom left: kidneys; bottom right: muscle.
