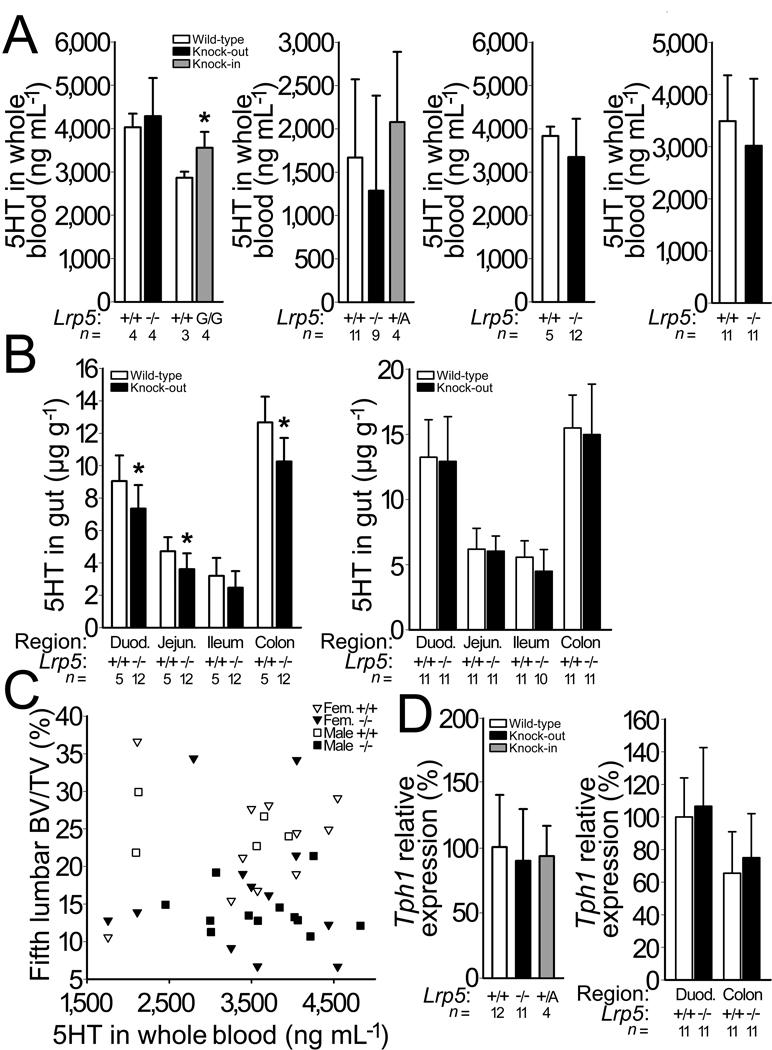
Figure 4.
Effect of Lrp5 genotype on serotonin (5HT) levels and on Tph1 expression. (a) Graphs depicting whole blood 5HT measured by HPLC in 6-mo-old Lrp5 WT and knockout mice that had been backcrossed to C57BL6/J, and in Lrp5 WT and HBM knockin (G/G) mice on a mixed 129Sv/C57BL/6J background (far left), in 3-mo-old Lrp5 WT, knockout and HBM knockin (+/A) mice on a mixed 129Sv/C57BL/6J genetic background (middle left), in 3-mo-old male (middle right) and 13-mo-old female (far right) WT and knockout littermates on a mixed 129SvEvBrd/ C57BL/6J-Tyrc-Brd background. (b) Graphs depicting the quantity of 5HT extracted from several regions of the intestine, beginning in the duodenum and proceeding through the jejunum, ileum, and proximal colon in 3-mo-old male (left) and in 13-mo-old female (right) Lrp5 WT and knockout littermates on a mixed 129SvEvBrd/ C57BL/6J-Tyrc-Brd background. (c) Scattergram depicting vertebral trabecular BV/TV and whole blood 5HT measurements in individual Lrp5 WT (open symbols) and knockout (filled symbols) littermates. Correlations between BV/TV and whole blood serotonin were r2=0.13 (p = 0.16) for male mice, and r2=0.02 (p = 0.53) for female mice. (d) Graphs depicting normalized Tph1 transcript levels in duodenum RNA extracts from Lrp5 WT, knockout, and HBM knockin (+/A) mice on a mixed 129Sv/C57BL/6J genetic background (left) and duodenum and colon RNA extracts from Lrp5 WT and knockout mice on a 129SvEvBrd/C57BL/6J-Tyrc-Brd background (right) with Gapdh serving as the internal control. The mean Tph1 expression level for Lrp5 WT duodenum is set as 100%. The numbers of mice studied (n =) are indicated, as are error bars equal to 1 s.d. Asterisks (*) indicate a significant difference (p < 0.05) compared to WT mice.

