
Figure 7.
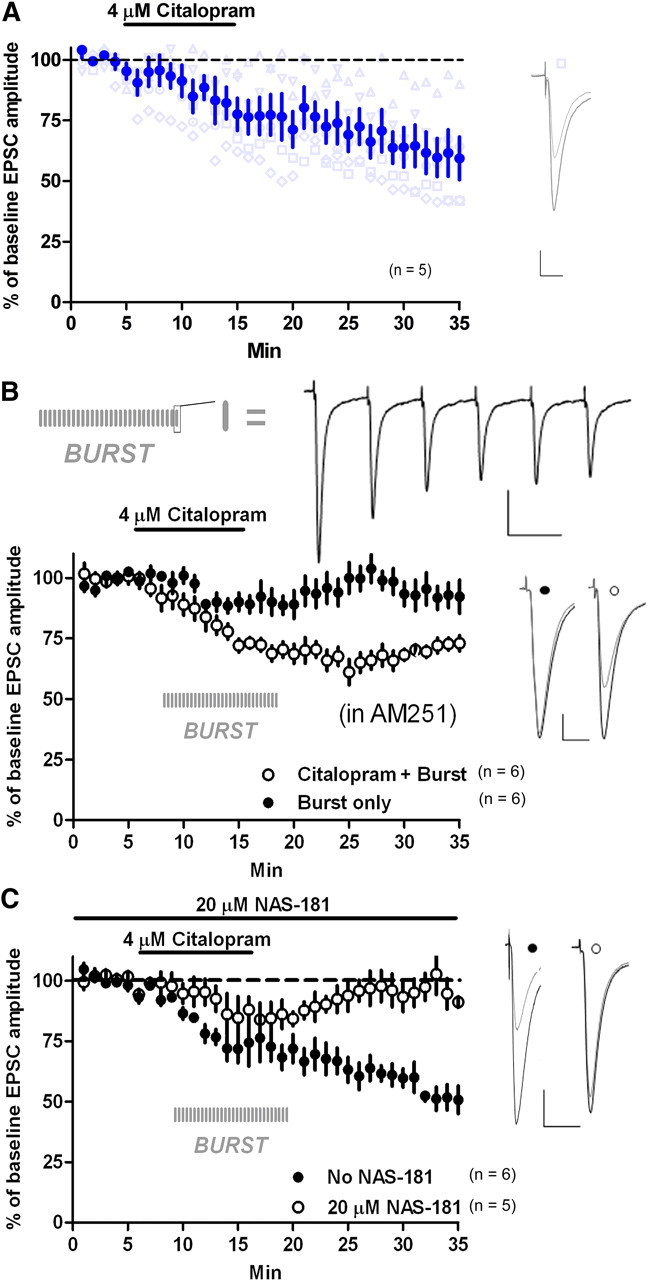
Endogenous 5-HT–LTD. A, Citalopram (4 μm, 10 min) induced LTD (blue circles). Three of five cells showed LTD, whereas the remaining neurons showed little to no depression of EPSC amplitude (gray triangles). B, Cit-Burst induced LTD. AM251 (3 μm) was present throughout. Each vertical, gray line indicates when a six-pulse burst was delivered. At top is a representative trace of a six-pulse burst. C, NAS-181 (20 μm) blocked Cit-Burst-induced depression. AM251 was not present. Calibration: B, six-pulse traces, 100 pA, 50 ms; all other traces; 100 pA, 20 ms.