
Fig. 7.
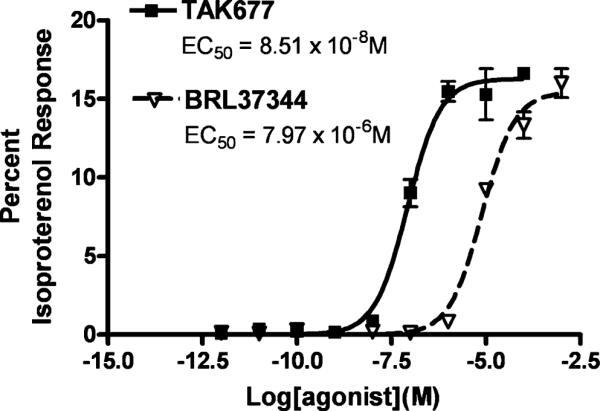
cAMP Assay of UROTSA cells stimulated with TAK677 and BRL37344. The data are illustrated for TAK677 and BRL37344 only. The data points were normalized to the maximal isoproterenol response (Emax) in the same assay. Therefore the fitted curve efficacies (Emax) represent a normalized efficacy relative to isoproterenol. The Emax values (relative to the maximal isoproterenol response) are 16.28 and 15.4% for TAK677 and BRL37344, respectively for the illustrated experiment. The fitted potency values for the individual agonists are: TAK677 EC50=8.51×10⁻⁸ M; BRL37344 EC50=7.97×10⁻⁶ M; Isoproterenol EC50=1.01×10⁻⁷ M). Error bars SEM of three determinations. Similar results were obtained in two additional experiments (see Table 1)