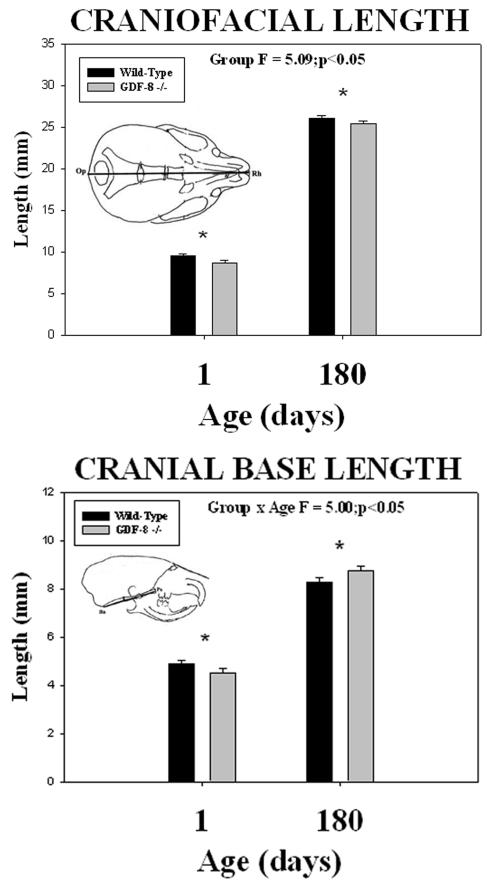
Figure 6.
Mean (+/− S.E.) craniofacial length (top) and cranial base length (bottom) by age and group and the results of statistical analysis. Note the significantly (asterisks) shorter craniofacial length in the myostatin (GDF-8−/−) -deficient mice compared to the wild-type control mice at both 1 and 180 days of age. In contrast, note the significantly (asterisks) shorter cranial base length at 1 day of age and significantly greater cranial base length at 180 days of age in the myostatin (GDF-8−/−) -deficient mice compared to the wild-type control mice.

