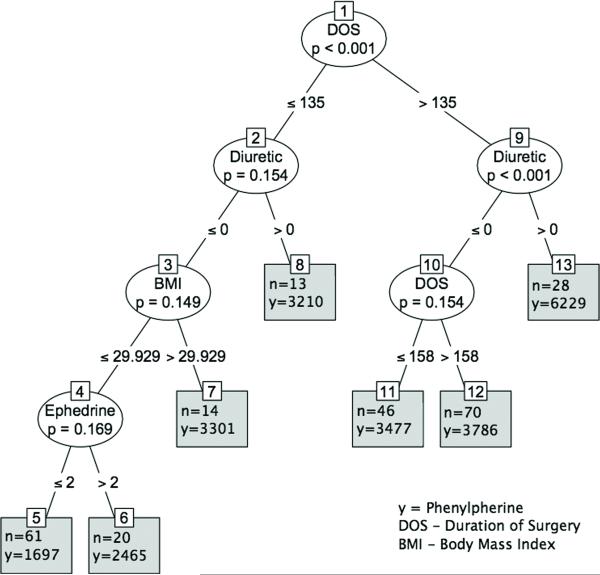
FIGURE 4.
Tree diagram from unbiased recursive partitioning under a conditional inference framework20. The plot may be interpreted as follows. To express the effect size of the independent variables in the regression model, we formulated a classification and regression tree (CART). The duration of surgery was the covariate with the highest association with the outcome. The data were then split into two groups (less than and including 135 minutes or more than 135 minutes). For those more than 135 minutes for duration of surgery, the next highly associated covariate was diuretic therapy. The data were again split into two groups: patients taking diuretics (diuretics >0), and patients not taking diuretics (diuretics < 0). For those not taking diuretics, the most associated variable was again duration of surgery. One can similarly interpret other branches of the tree.

