
Figure 2.
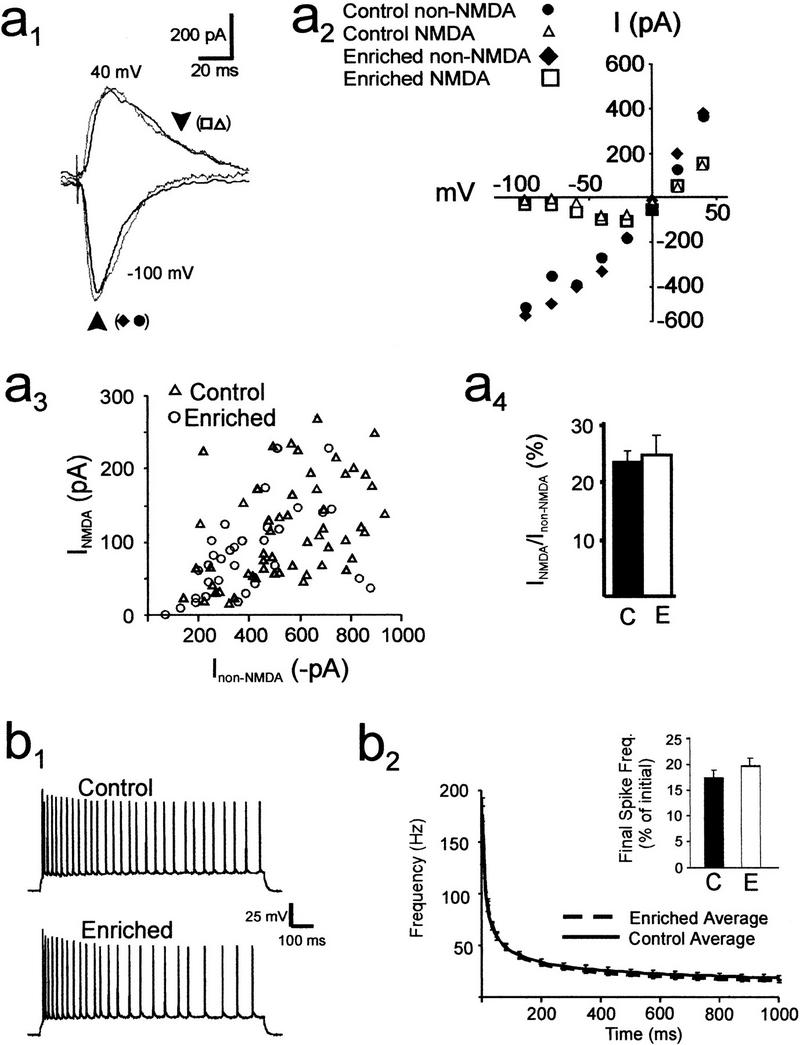
Biophysical and electrophysiological properties of CA1 neurons. (a1) Superimposed sample traces of excitatory postsynaptic currents, evoked by stimulation of Schaffer collateral fibers, in voltage-clamped CA1 pyramidal cells from control (black) and 8-wk enriched mice (gray). Cells were held at −100 mV (lower traces) and +40 mV (upper traces). Arrows demarcate time points for measurements of current amplitudes shown in a2 and a3. The lower arrow indicates peak non-NMDA current, while the upper arrow, placed 35 msec after the peak, is the estimate of NMDA current amplitude. (a2) I-V plot for peak current and the current at 35 msec after the peak in enriched and control cells. (a3) Scatter plot of peak non-NMDA (VM = −100 mV) versus NMDA (VM = +40 mV) currents elicited at various stimulus intensities in CA1 pyramidal neurons from control (open triangles, 32 cells from 13 mice) and enriched mice (open circles, 21 cells from six mice). (a4) The average ratio (±SEM) of NMDA to non-NMDA current amplitudes was derived from the scatter plot in a3 and showed no significant difference between cells from control (C) and enriched (E) mice. (b1) Action potentials in pyramidal CA1 neurons evoked by a 1-sec pulse of intracellular current injection. (b2) Plot of average instantaneous spike frequency (Hz) versus time after the start of a current pulse. No significant differences in these curves were observed for CA1 pyramidal neurons from control (solid line, n = 16 cells from 12 mice) and enriched slices (broken line, n = 19 cells from six mice; P > 0.2). Inset bar graph: histogram showing the mean spike frequency measured during the last 400 msec of a spike train, expressed as a percentage of the average spike frequency measured during the initial 50 msec of the spike train. No significant difference was observed between the two groups (C = control, E = enriched).