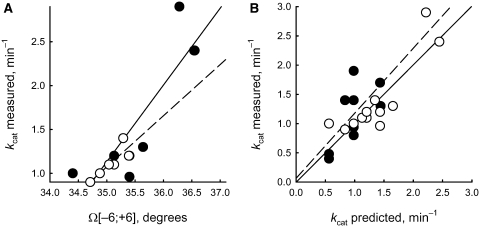
Figure 6.
Linear correlations between the experimentally measured kcat values and either (A) the twist angle averaged over −6 to +6 position of the ODNs [Equation (3)] as calculated by the ACTIVITY software or (B) the kcat values predicted by Equations (1), (3) and (7). Open circle and dashed line, learning set: (A) each strand of ds ODN1–ODN6 (r = 0.862, α <0.0005); (B) ds ODN1–ODN12 (r = 0.869, α <0.00025). Closed circle and straight line, control set: (A) each strand of ds ODN7–ODN12 (r = 0.835, α <0.001); (B) mismatched ds ODN13–ODN21 (r = 0.667, α <0.05).

