Figure 6.
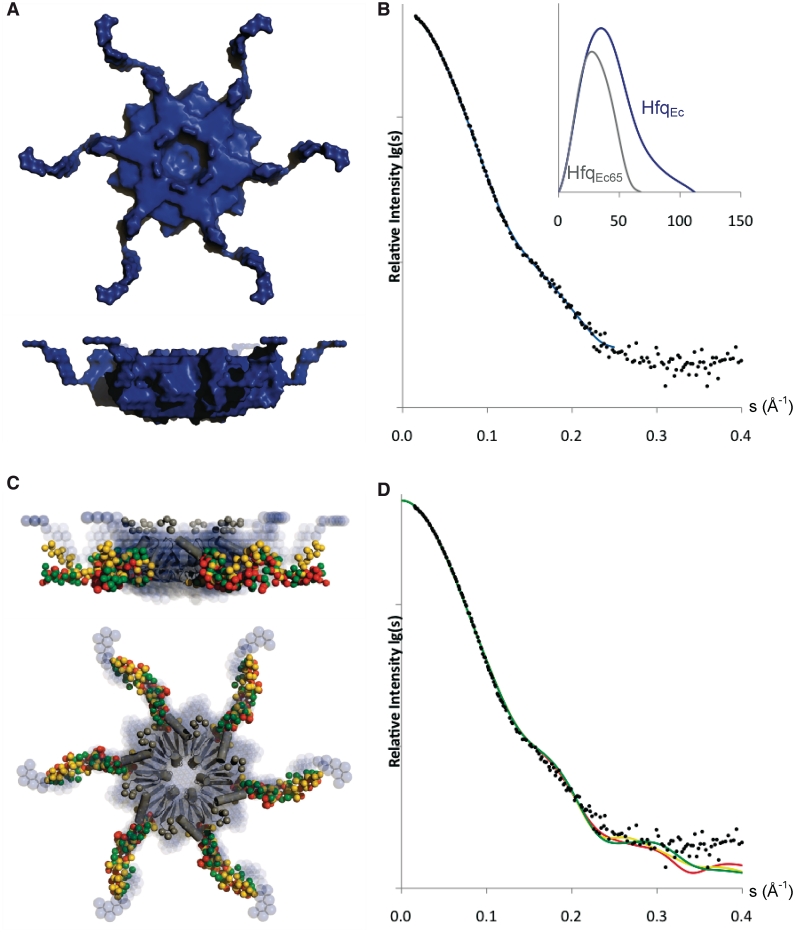
Shape models of HfqEc. (A) Surface representation of ab initio model. (B) Calculated scattering curve of ab initio model (blue) overlaid with experimental X-ray scattering data, inserted is the pair-distribution function for HfqEc65 (grey) and full-length HfqEc (blue). (C) Superimposition of the three best rigid-body HfqEc models from three iterations of modeling (red, gold and green). In the center, the crystal structure of the HfqEc (amino acids 6–65) hexameric core is represented as grey ribbons and the N-termini as grey spheres. The ab initio model is represented as blue spheres in the background. (D) Calculated scattering curves to a maximum range of momentum transfer (s) of 0.4 Å−1 for the three best rigid-body models (corresponding in red, gold and green).

