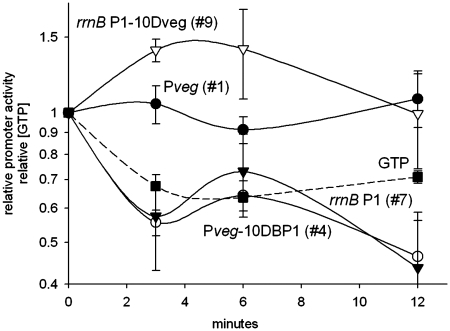
Figure 4.
Relative changes in promoter activity in B. subtilis after decoyinine treatment. Cells were grown to early log phase (OD600 ∼0.3) and at time 0 treated with decoyinine. RNA was extracted before (time 0) and at indicated time points after the addition of decoyinine. Determination of promoter activity was as in Figure 1. Promoter activities and GTP concentration were set as 1 at time 0. Numbers (#) corresponding to promoter constructs used in in vitro experiments are indicated in the plot together with the name of the construct. Filled squares (dashed line), relative GTP concentration; filled triangles, rrnB P1 (strain RLG7554); closed circles, Pveg (strain RLG7555); open circles, Pveg-10DBP1 (#4) (strain LK606); empty triangles, rrnB P1-10Dveg (#9) (strain LK607). The values are averages of at least four experiments conducted on different days.

