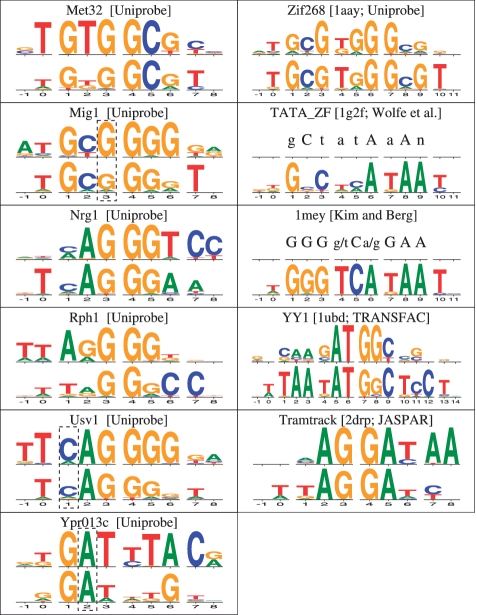
Figure 7.
Binding specificity predictions. For each benchmark protein, the experimental binding profile is shown above the structure-based specificity prediction. Experimental data sources are indicated in brackets. PFM columns are numbered so that columns 1-3 correspond to the last finger, columns 4-6 correspond to the second-to-last finger, and so on (see Figure 4). For the three boxed columns, structural determinants of binding preferences are illustrated in Figure 10.

