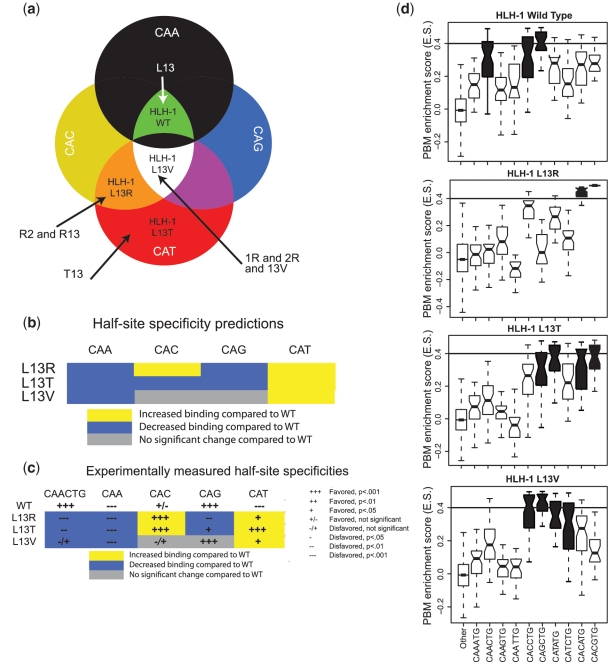
Figure 4.
Prediction and experimental validation of HLH-1 Leu13 mutant E-box half-site specificities. (a) Classification of the three HLH-1 mutant proteins based on the E-box half-site specificity diagram in Figure 3b. (b) Predictions of the half-site specificities for each of the HLH-1 Leu13 mutants. (c) Summary of the statistical analysis of the observed half-site specificities determined from PBM data for each of the HLH-1 mutants. (d) Boxplot representation of the PBM-derived E-box specificities of HLH-1 wild-type and mutant proteins. Significantly bound E-boxes are colored in black (see ‘Materials and Methods’ section). Eight-mers that do not contain an E-box are marked as ‘other’. For each box, the central horizontal bar shows the median of the distribution, the box’s edges mark the 25th and 75th percentile and the whiskers represent the most extreme points of the distribution, which were not determined as being outliers. The horizontal bar of ES value of 0.4 shows our significance ES threshold, as previously determined (7).

