Figure 4.
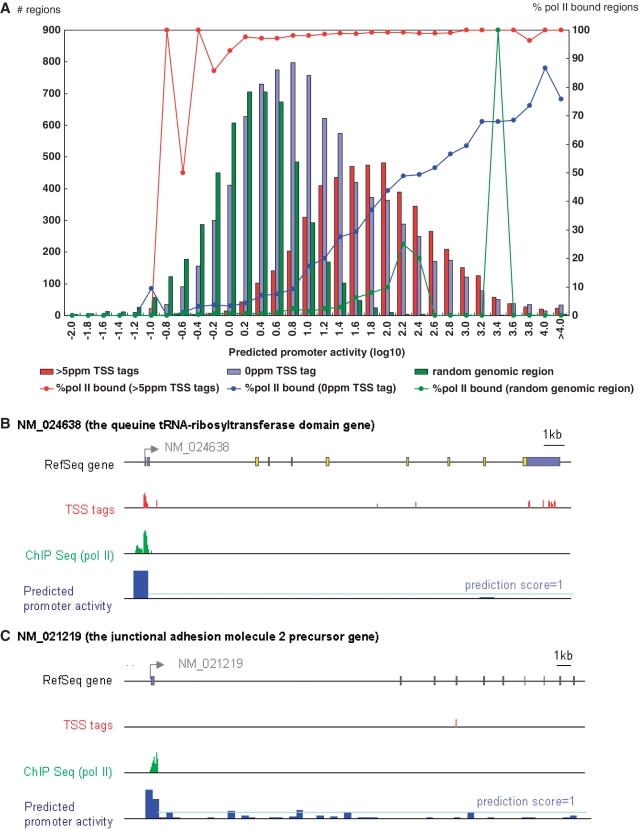
Validation of the prediction model in vivo using TSS-Seq and pol II ChIP-Seq data. (A) Distribution of the 5′-end regions of RefSeq genes with observed TSS tag counts (indicated by the y-axis; left side) and prediction scores (indicated by the x-axis). Red, blue and green bars represent populations indicated in the inset. Red, blue and green lines represent the frequencies of the promoters with pol II binding, as detected by ChIP-Seq (indicated by the y-axis; right side). (B) and (C) are examples of digital TSS tag counts (red bars), pol II binding (green bars) and predicted promoter activities (blue bars) in the RefSeq regions. (B) Exemplifies a case in which all three types of data concordantly indicate the active transcription of the gene. (C) Exemplifies a case in which our model predicted significant promoter activity, although no TSS tags were identified from the corresponding genomic region. The pale-blue line indicates a prediction score of 1.

