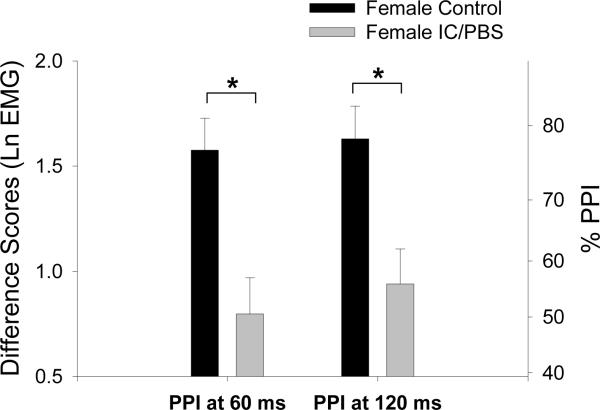
Figure 2.
Prepulse inhibition of the acoustic startle response. Values are estimated means (with standard error bars). Greater prepulse inhibition is indicated by a more positive difference score. The right axes shows percent change derived from the log-transformed difference scores. Significance is indicated for group differences in percent PPI. Ln μV = natural log transformed microvolts.

