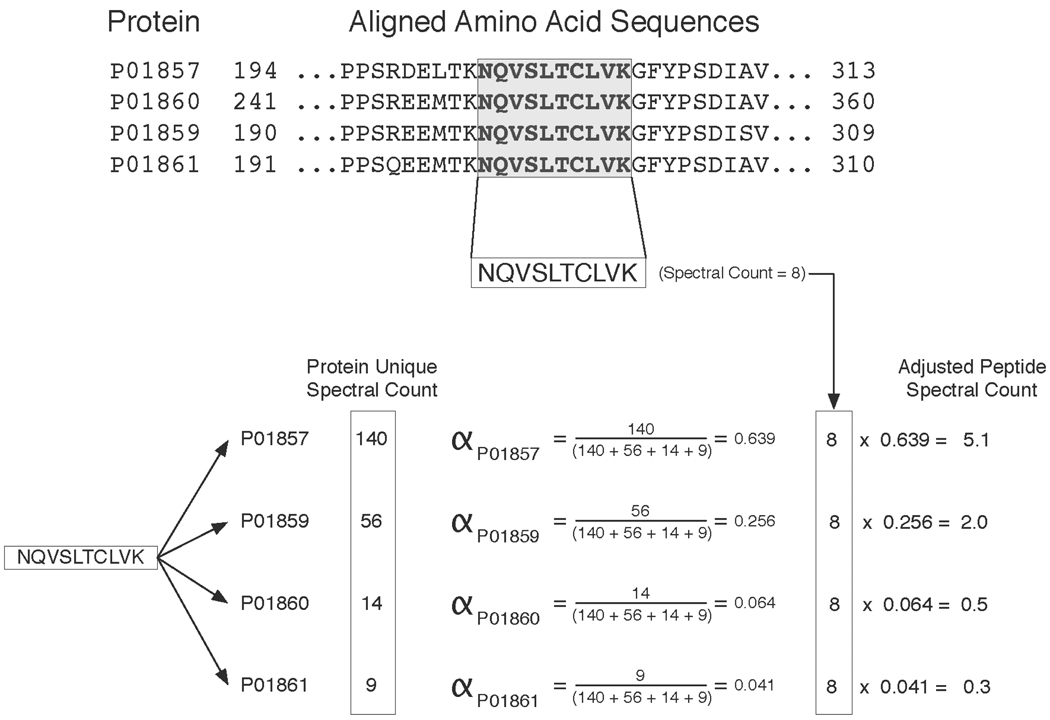
Figure 2. Illustration of the spectral count adjustment procedure.
Example of how the alpha factor is calculated for a single peptide shared among 4 immunoglobulins (IGHG1 through IGHG4) identified in the EPS data set. The upper panel shows the protein sequence alignment between the 4 immunoglobulins and highlights a peptide common to all of them. This specific peptide has 8 unique spectra assigned to it making its spectral count 8. The lower panel shows how alpha is computed for each of the proteins that share this peptide. The alpha factor is based upon the unique spectral count of each protein. In this example PO1857, PO1859, PO1860, PO1861 each have unique spectral counts of 140, 56, 14, and 9 respectively. These unique spectral counts are derived from the peptides that are exclusive to each of the proteins in the example. The peptide’s total spectral count of 8 is multiplied by the alpha factor of each protein. The resulting values indicate how the peptide’s 8 spectral counts are to be distributed among each of the 4 proteins.

