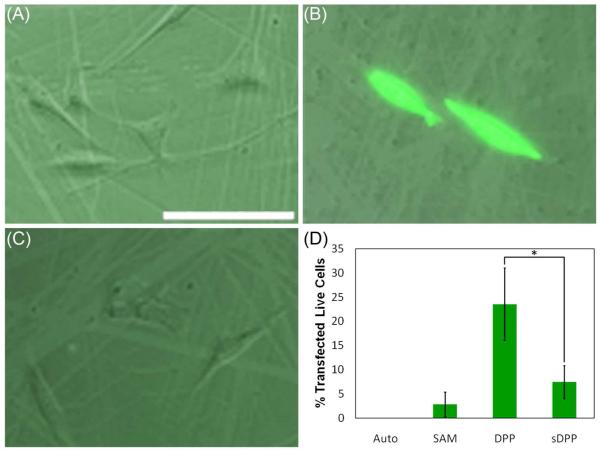
Figure 7.
Transfection with the modified surfaces. The transfection efficiencies of (A) a SAM-modified gold-coated glass surface, (B) a 0.1 μg/μL DPP-treated SAM-modified surface, and (C) a 0.1 μg/μL sDPP-treated SAM-modified surface were assessed in NIH/3T3 cells 24 h post-transfection by fluorescence microscopy (scale bar [shown in (A)] = 100 μm). GFP expression was further quantified by flow cytometry (D). “Auto” indicates untransfected NIH/3T3 cells. The error bars represent one standard deviation from the mean of 3 separate samples. Statistically significant differences were observed between the samples indicated with an asterisk (p≤0.04).

