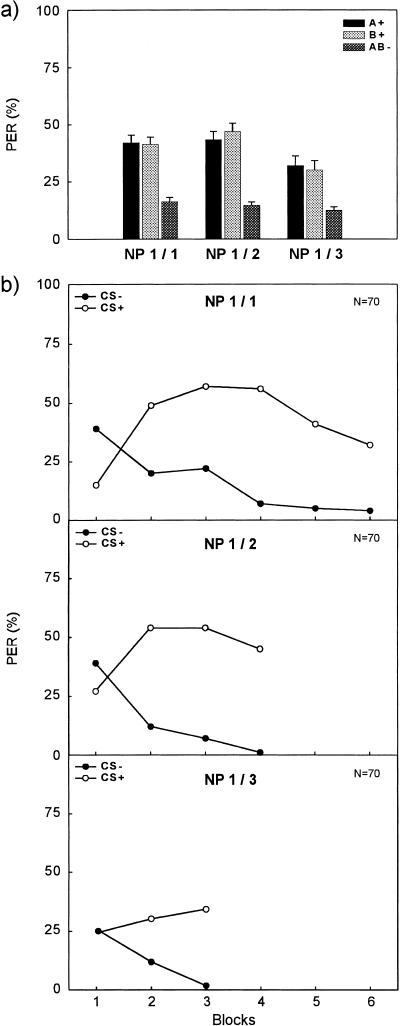
Figure 2.
Conditioned proboscis extension response (% PER) across trials of a negative patterning discrimination. (a) Averaged % PER across all trials of A+, B+, and AB− for Group NP1/1 (left), Group NP1/2 (middle), and Group NP1/3 (right). (b) Course of % PER to the reinforced elements (CSs+; open circles) and to the nonreinforced compound (CS−; filled circles). The upper panel shows responding for Group NP1/1, with a ratio of 1/1 between the number of presentations of the reinforced elements and the nonreinforced compound. Data were blocked to obtain six blocks of two CS+ trials and six blocks of two CS− trials. The middle panel shows responding for Group NP1/2 with a ratio of 1/2 of reinforced and nonreinforced trials. Data were blocked to obtain four blocks of two CS+ trials and four blocks of four CS− trials. The lower panel shows responding for Group NP1/3 with a ratio of 1/3 of reinforced and nonreinforced trials. Data were blocked to obtain three blocks of two CS+ trials and three blocks of six CS− trials.

