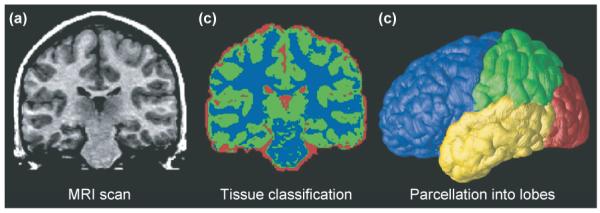
Figure 1.

Typical processing steps in an analysis of MRI brain scans. (a) A typical coronal section from a T1-weighted MRI scan of the brain. (b) The result of applying a tissue-classification approach to classify image voxels as gray matter (green), white matter (blue) or cerebrospinal fluid (CSF; red). Non-brain tissues such as scalp and meninges surrounding the brain have been digitally edited from the image. (c) Parcellation of the brain into the frontal lobe (blue), parietal lobe (green), occipital lobe (red) and temporal lobe (yellow). This subdivision of anatomy is performed with the aid of a cortical surface model on which sulcal landmarks separating the lobes can be reliably identified. Once partitioned in this way, the volumes of each tissue type in the major lobes can be computed and growth curves established for each major lobe. The quantity of gray and white matter in the brain and of CSF in the ventricles and cortical sulci can be computed and compared across subjects and over time. Maps of these tissue types (b) can be used to calculate shape, size and other statistics, and can also be subdivided into smaller regions to determine the amount of each tissue type in each lobe (c).
