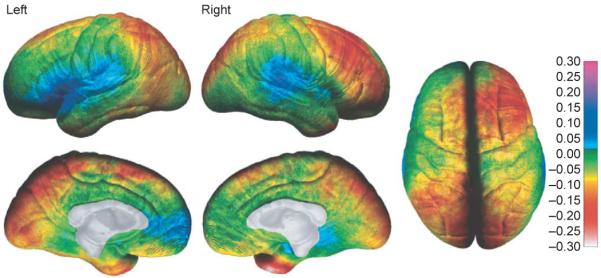
Figure 3.

Annualized rate of change in cortical thickness. The average rate of change in cortical thickness is shown in millimeters according to the color bar on the right (maximum gray-matter loss is shown in shades of red and maximum gray-matter gain is shown in shades of blue). Forty-five children were studied twice (two-year scan interval) between 5 and 11 years of age. Reproduced, with permission, from [12].
