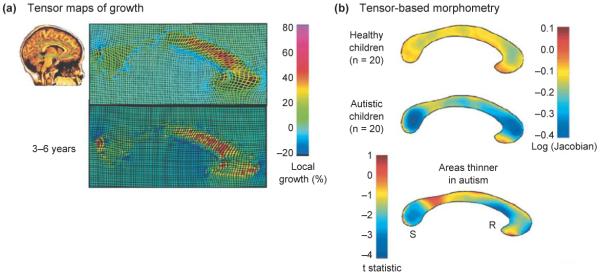
Figure 6.
Tensor maps of growth and tensor-based morphometry. (a) The corpus callosum (indicated by a green box) of a healthy three-year-old girl in a sagittal section from a 3D MRI scan. Using a follow-up scan thee years later, an elastic deformation field is computed that digitally aligns, or warps, the anatomy of the earlier time-point to match its shape at the later time point. The amount of local stretching of the anatomy is color-coded, indicating fastest growth rates (red) in the anterior corpus callosum. In a related approach (b), maps can be compiled to represent the average expansion factor required to deform an average corpus callosum shape elastically onto each subject in a set of healthy children and matched autistic children. This identifies areas of the corpus callosum that are thinner in autistic children, pinpointing where abnormal white-matter growth might lead to the disorder in early childhood. The letters ‘S’ and ‘R’ denote the splenium and rostrum of the corpus callosum, respectively. Data in (a) is adapted, with permission, from [22]; (b) is adapted, with permission, from [53].

