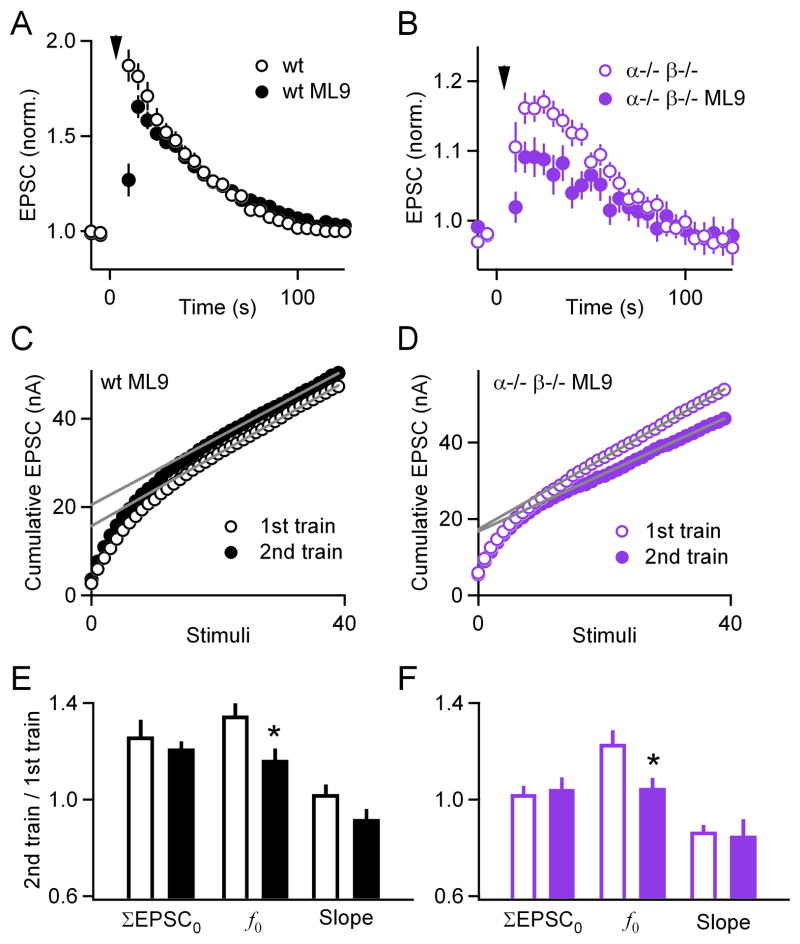
Figure 4. Limited contribution of myosin light chain kinase to PTP.
(A through B), Plots of normalized EPSC amplitude as a function of time before and after PTP-inducing tetanization (inverted triangles) in slices from wild-type (black) and double knockout (purple) animals. Incubation with the MLCK inhibitor ML9 (filled symbols) partially affected PTP. (C through D), Plots of cumulative EPSCs as a function of stimulus number in slices from wild-type (C) and double knockout (D) animals, incubated with ML9. Gray lines are linear fits to the last 15 points. (E through F), Plots of ratios (2nd train/1st train) for ΣEPSC0, f0, and the slope of the linear fits. Incubation with ML9 (filled bars) significantly decreased f0 in both wild-types (black) and double knockouts (purple). * p < 0.05.

