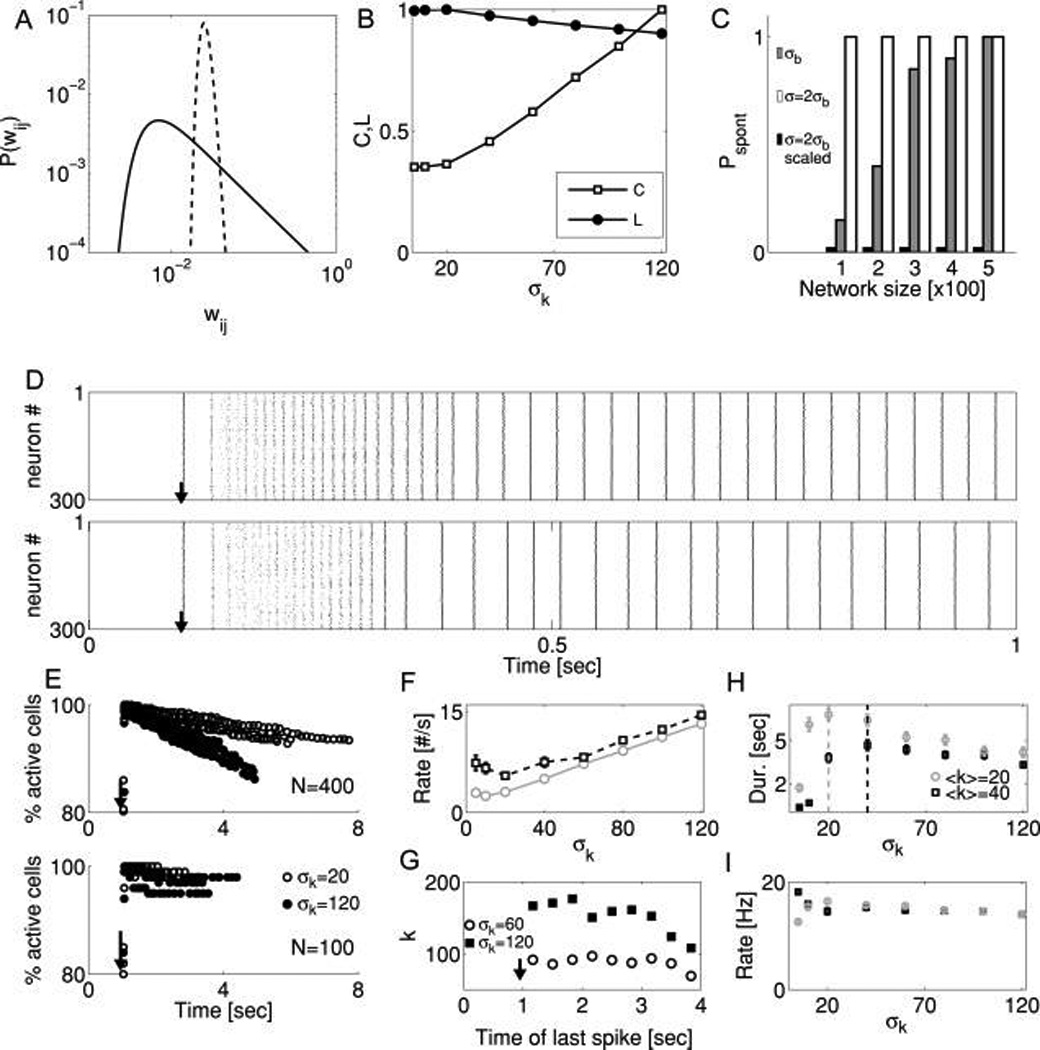
Figure 5.

Synaptic scaling regularizes and stabilizes reverberation. (A) Probability distribution P(w) of synaptic weights for two model networks (N = 500). Each network was generated such that each neuron received a number of inputs determined by a mean 〈k〉 = 40 with standard deviation σk. The amplitude of all inputs was then scaled such that the summed input to each neuron in the network had constant amplitude. Dashed line: σk = 5; solid line: σk = 120. (B) Incidental changes in topological measures (clustering coefficient, C, and path length, L, both scaled relative to their maximal values for clarity of presentation) accompanying changes in σk. (C) Probability of observing a spontaneous outbreak of activity from a resting network during a 10 second time window, for different scenarios of network size and connectivity. For networks whose connections were determined only by network size p = 〈k〉/N, the variability in input number is given by a binomial distribution . Without synaptic scaling, such networks were vulnerable to spontaneous activity (gray bars) due to variability in input number across neurons: some neurons receive many inputs, and spontaneously fire, triggering the network. When neurons receive synapses with different probabilities, the distribution is broader (2σb) and spontaneous activity is guaranteed (white bars). However, spontaneous activity was abolished in all networks when synaptic inputs were scaled according to the summed input onto each neuron (black bars). For all cases shown, 〈k〉 = 22. (D) Sample raster plots of evoked network activity (N = 300, 〈k〉 = 22). Upper panel: Unscaled network that did not exhibit spontaneous activity in 10 sec observation window. Lower panel: Same network with synaptic strengths scaled. Arrow indicates stimulation time. Note that scaling has very little effect on the structure of a normal reverberation. (E) The number of active neurons per PSC cluster declines during the reverberation, prior to sudden termination, for networks of different sizes (upper panel, N = 400; lower panel, N = 100). Open circles: σk = 20. Closed circles: σk = 120. Data points are pooled results from five independent realizations. Reverberation was initiated with a brief stimulus at T = 1 second. (F)Quantification of (E). The rate of change in the number of active neurons during the reverberation is nearly linear in the variability of synaptic input number σk. N = 500. Gray circles: 〈k〉 = 20; black squares: 〈k〉 = 40. (G) Due to scaling, the number of synaptic inputs received by a neuron predicts when that neuron will drop out of the reverberation. Neurons with numerous but small-amplitude inputs will drop out earlier. Black squares: σk = 120; open circles: σk = 60. N = 500. Stimulus at T = 1 second. (H, I) For a wide range of heterogeneities in synaptic input number, both the duration of reverberation (H) and the rate of PSC cluster appearance (I) are nearly constant. Keys are the same as in (F). For (F–I), all data points are averages over 20 realizations. Data points are mean ± S.E.M.
