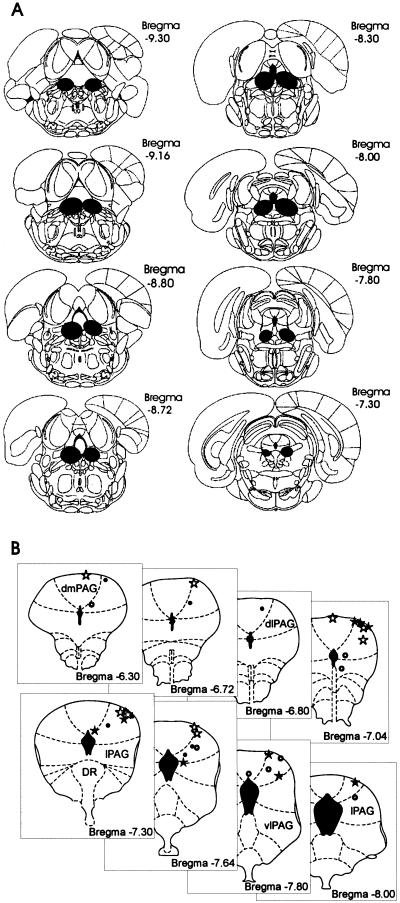
Figure 1.
Schematic drawing of target brain sites. (A) Representative ventral periaqueductal gray lesion. (B) Sites of stimulation electrodes in the dorsal periaqueductal gray. Sham-lesion animals submitted to electrical (ο) or chemical stimulation (⋆). vPAG-lesion animals submitted to electrical (·) or chemical stimulation (★), respectively.

