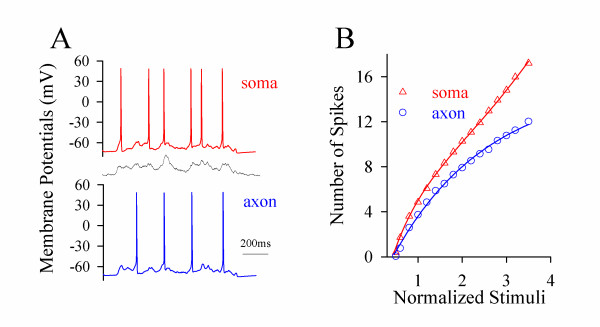
Figure 6.
Computational simulation based on spike thresholds and refractory periods at the soma and axon favors the sequential spikes being somatic in origin. A) The number of spikes in computational simulation is higher at the soma (red trace) than the axon (blue) induced by in vivo signal (middle). B) illustrates the number of spikes vs. the intensity of stimulus pulses at the soma (red triangle symbols) and the axon (blue circles).

