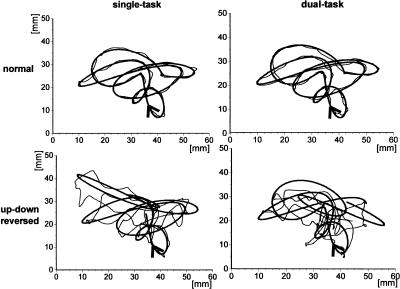
Figure 1.
Original data of target (bold line) and cursor (thin line) paths in four experimental episodes of one subject under normal viewing conditions (top graphs) and immediately after up–down reversal (bottom graphs). Responses in single- (left graphs) and dual-task (right graphs) conditions are shown. Target movement direction is indicated by an arrow. Note the deterioration of tracking performance after reversal.

